Mutual Fund Selection Framework
A Comprehensive Guide to Building Your Investment Portfolio
NRI Wealth Partners | Wealth Management for Global Indians Last Updated: December 2025
Table of Contents
- Introduction
- Types of Mutual Funds
- How to Pick Funds Based on Investment Goals
- Key Metrics to Evaluate
- Direct vs Regular Plans
- Active vs Passive Investing
- SIP Strategy Guide
- Lumpsum vs SIP Comparison
- Portfolio Construction
- Rebalancing Strategy
- Red Flags and Exit Strategies
- Sample Portfolios
- Frequently Asked Questions
Introduction
Investing in mutual funds is one of the most accessible ways for NRIs to build wealth and secure their financial future. Whether you're saving for retirement, your child's education, or a down payment on a home, mutual funds offer flexibility, diversification, and professional management.
However, with over 2,000 mutual fund schemes available in India, choosing the right funds can be overwhelming. This framework provides a systematic approach to selecting mutual funds that align with your financial goals, time horizon, and risk tolerance.
Why Mutual Funds for NRIs?
- Diversification: Invest in a portfolio of securities with minimal capital
- Professional Management: Expert fund managers make investment decisions on your behalf
- Flexibility: Easy entry and exit with no lock-in periods (except ELSS)
- Tax Efficiency: Favorable long-term capital gains tax treatment
- Convenience: Online account opening and transactions from anywhere in the world
- Rupee Cost Averaging: SIP investments reduce market timing risk
Types of Mutual Funds
1. Equity Funds
Definition: Invest primarily in stocks (minimum 65% equity exposure)
Sub-categories:
| Category | Market Cap | Risk Level | Returns | Ideal For |
|---|---|---|---|---|
| Large-cap | Top 100 companies | Low-Moderate | 10-12% | Conservative investors, stable growth |
| Mid-cap | 101-250 companies | Moderate-High | 12-15% | Balanced investors, 7+ year horizon |
| Small-cap | 251+ companies | High | 15-20%+ | Aggressive investors, 10+ year horizon |
| Multi-cap | Across all caps | Moderate | 12-14% | Core holdings, diversification |
| Sectoral/Thematic | Specific sectors/themes | High | Variable | Tactical allocation, conviction plays |
Higher expected returns come bundled with higher swings. The mid-points of the indicative return bands above illustrate how the risk-return trade-off climbs as you move down the cap curve:
Indicative Return Range by Equity Category (mid-point)
Illustrative ranges, not a forecast. Past performance does not guarantee future results.
Best For: Long-term wealth creation, retirement planning
2. Debt Funds
Definition: Invest primarily in bonds and fixed-income securities
Sub-categories:
| Category | Maturity Period | Risk Level | Returns | Ideal For |
|---|---|---|---|---|
| Liquid Funds | 0-90 days | Very Low | 6-7% | Emergency funds, short-term goals |
| Ultra-short Duration | 0-1 year | Very Low | 6-8% | Short-term savings |
| Short Duration | 1-3 years | Low | 7-8% | 1-3 year goals |
| Medium Duration | 3-7 years | Moderate | 7-9% | 3-7 year goals |
| Long Duration | 7+ years | Moderate-High | 8-10% | Stable income, interest rate plays |
| Credit Opportunities | Mixed | High | 9-12% | Income generation, higher risk |
Best For: Capital preservation, emergency funds, predictable income
3. Hybrid Funds
Definition: Mix of equity and debt investments for balanced growth and stability
Sub-categories:
| Category | Equity:Debt Ratio | Risk Level | Returns | Ideal For |
|---|---|---|---|---|
| Conservative Hybrid | 10-30% equity | Low | 8-9% | Risk-averse investors, income needs |
| Balanced Hybrid | 50-60% equity | Moderate | 10-12% | Balanced investors, all-purpose holding |
| Aggressive Hybrid | 70-80% equity | Moderate-High | 11-14% | Aggressive investors, long-term goals |
| Equity-oriented Hybrid | 65-75% equity | Moderate-High | 12-15% | Growth seekers, diversified exposure |
Best For: All-in-one portfolios, balanced investors, tax-efficient investing
4. Gold Funds
Definition: Invest in physical gold or gold-related securities
Types:
- Gold ETFs: Track gold prices, trade on stock exchanges
- Gold Mutual Funds: Invest in gold ETFs or physical gold
- Gold Savings Funds: Systematic investment in gold
Best For: Inflation hedge, portfolio diversification (5-10% allocation)
Expected Returns: Aligned with gold price movements (5-10% annually in growth periods)
5. International Funds
Definition: Invest in stocks and bonds of companies outside India
Sub-categories:
| Category | Focus | Risk Level | Returns | Ideal For |
|---|---|---|---|---|
| US Focused | US equities | Moderate | 10-15% | Global diversification, USD exposure |
| Developed Markets | Europe, Japan, Australia | Moderate | 10-12% | Developed market exposure |
| Emerging Markets | China, Brazil, emerging economies | High | 12-18% | Growth, non-India exposure |
| Global Diversified | Mix across geographies | Moderate | 11-13% | Broad diversification, natural hedge |
Best For: Portfolio diversification, currency hedging (especially for overseas expenses)
Currency Impact: Returns affected by INR-USD and other currency fluctuations
How to Pick Funds Based on Investment Goals
Step 1: Define Your Investment Goal
Decision Tree: Identifying Your Investment Goal

Start
  ├─ Retirement Planning (20+ years away)
  │  └─ 70-80% Equity, 20-30% Debt
  │
  ├─ Child's Education (5-15 years away)
  │  ├─ If 10+ years away: 60-70% Equity
  │  └─ If 5-10 years away: 40-50% Equity, 50-60% Debt
  │
  ├─ Home Purchase (3-7 years away)
  │  └─ 30-50% Equity, 50-70% Debt
  │
  ├─ Emergency Fund (Immediate)
  │  └─ 100% Liquid Debt Funds
  │
  ├─ Short-term Savings (1-3 years)
  │  └─ 100% Short/Ultra-short Debt Funds
  │
  └─ Wealth Creation/General Investing
     └─ 60-80% Equity based on risk tolerance
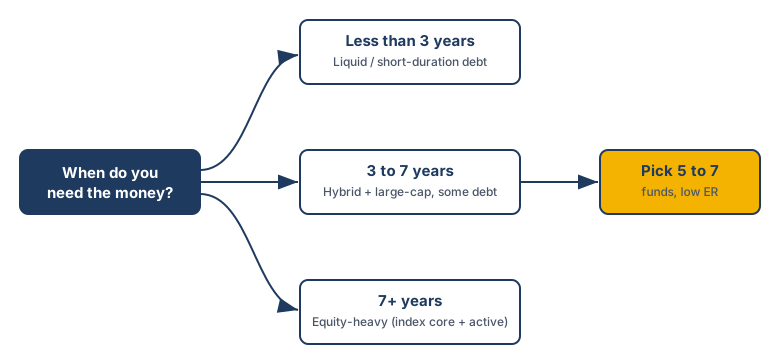
The same logic reduces to a single question — when do you need the money? — which then points you at a fund type:
Step 2: Assess Your Time Horizon
How to Calculate:
- Time Horizon = Date you need the money - Today
Impact on Asset Allocation:
| Time Horizon | Equity | Debt | Hybrid | Action |
|---|---|---|---|---|
| < 1 year | 0% | 100% | 0% | Use liquid/savings funds |
| 1-3 years | 10-20% | 80-90% | Use as backup | Minimize volatility |
| 3-5 years | 30-50% | 50-70% | 40-60% | Balance growth & safety |
| 5-10 years | 50-70% | 30-50% | 60-70% | Growth-focused |
| 10+ years | 70-90% | 10-30% | 70-80% | Maximize growth potential |
Key Principle: Longer horizons allow you to weather market volatility and benefit from compound growth.
Step 3: Evaluate Your Risk Appetite
Risk Appetite Assessment

Question 1: If your portfolio falls 20% in a market crash, would you:
  a) Panic and sell immediately? → Conservative
  b) Worry but hold on? → Balanced
  c) Stay calm and buy more? → Aggressive

Question 2: Your investment philosophy is:
  a) Capital preservation is paramount → Conservative
  b) Steady growth with some safety → Balanced
  c) Maximum growth at all costs → Aggressive

Question 3: Investment experience level:
  a) Beginner, few investments → Conservative
  b) Moderate experience → Balanced
  c) Experienced investor → Can be Aggressive

Question 4: Your income stability:
  a) Variable/unstable income → Conservative
  b) Stable income → Balanced
  c) Very stable, multiple income sources → Aggressive
Risk Profiles:
Conservative Profile
- Characteristics: Low risk tolerance, stable income, near-term goals
- Allocation: 20-30% Equity, 70-80% Debt
- Expected Returns: 8-9% annually
- Volatility: Low
- Suitable Funds:
- Conservative Hybrid Funds
- Liquid Funds
- Medium Duration Debt Funds
- Large-cap Equity Funds (small allocation)
Balanced Profile
- Characteristics: Moderate risk tolerance, long-term goals, stable income
- Allocation: 50-60% Equity, 40-50% Debt
- Expected Returns: 10-12% annually
- Volatility: Moderate
- Suitable Funds:
- Balanced Hybrid Funds
- Multi-cap Equity Funds
- Large & Mid-cap Funds
- Short to Medium Duration Debt Funds
Aggressive Profile
- Characteristics: High risk tolerance, 10+ year horizon, comfortable with volatility
- Allocation: 75-90% Equity, 10-25% Debt
- Expected Returns: 12-15% annually
- Volatility: High
- Suitable Funds:
- Multi-cap & Mid-cap Equity Funds
- Small-cap Funds (tactical)
- Aggressive Hybrid Funds
- International Equity Funds
- Sectoral Funds (tactical)
Key Metrics to Evaluate
1. Returns (Historical Performance)
Understanding Different Return Periods:
- 1-Year Return: Recent performance, less reliable indicator
- 3-Year Return: Emerging trend, more meaningful
- 5-Year Return: Good indicator of fund quality
- 10-Year Return: Best measure of long-term consistency
CAGR (Compound Annual Growth Rate):
Formula: CAGR = [(Ending Value / Beginning Value)^(1/Number of Years)] - 1

Example:
Investment: Rs 1,00,000
Value after 5 years: Rs 1,63,862
CAGR = [(163,862 / 100,000)^(1/5)] - 1 = 10% per annum
Key Rule: Prioritize consistency over absolute returns. A fund with stable 12% returns is better than one with 15% returns but high volatility.
2. Expense Ratio (ER)
Definition: Annual cost of managing the fund, expressed as percentage of AUM
Impact on Returns (Using 10-year horizon example):
Assumption: Annual Return = 12%

ER of 0.5%:
Final Amount = Rs 100,000 × (1.115)^10 = Rs 3,04,100

ER of 1.5%:
Final Amount = Rs 100,000 × (1.105)^10 = Rs 2,74,200

Difference: Rs 29,900 (9.8% lower returns!)

Benchmark for ERs:
- Large-cap Equity: 0.4-0.8%
- Mid/Small-cap Equity: 0.7-1.2%
- Debt Funds: 0.3-0.8%
- International Funds: 0.8-1.5%
Rule of Thumb: Choose funds with below-average ER for their category
3. Sharpe Ratio (Risk-Adjusted Returns)
Definition: Measures excess return per unit of risk taken
Formula:
Sharpe Ratio = (Return - Risk-free Rate) / Standard Deviation

Example:
Fund Return = 12%
Risk-free Rate = 6%
Standard Deviation = 10%

Sharpe Ratio = (12% - 6%) / 10% = 0.60
Interpretation:
- Higher Sharpe Ratio = Better risk-adjusted returns
- Compare Sharpe Ratios within the same fund category
- Benchmark: Sharpe Ratio > 0.50 is good, > 0.75 is excellent
Key Use: Identify funds that give good returns without excessive risk
4. Standard Deviation (Volatility)
Definition: Measures how much fund returns fluctuate over time
Interpretation:
Standard Deviation Levels:
- 5-8%: Low volatility (Debt funds, Conservative hybrids)
- 8-12%: Moderate volatility (Balanced funds, Large-cap equities)
- 12-18%: High volatility (Mid-cap, Small-cap funds)
- 18%+: Very high volatility (Sectoral, Emerging funds)
Practical Example:
Fund A: Average Return 12%, SD = 8%
- 95% of the time, returns will be between -4% to +28%

Fund B: Average Return 12%, SD = 15%
- 95% of the time, returns will be between -18% to +42%

Fund A is preferable for risk-averse investors despite same returns.
5. Fund Manager Track Record
Evaluation Criteria:
| Factor | What to Look For | Why It Matters |
|---|---|---|
| Tenure | Manager with 5+ years at fund | Consistency, market cycle experience |
| Track Record | Outperformance vs benchmark in multiple markets | Skill validation |
| Consistency | Outperformed in both bull and bear markets | Genuine skill, not luck |
| Previous Funds | Success at other funds managed | Reproducible skill |
| Investment Philosophy | Clear, coherent philosophy | Structured approach |
Where to Find:
- Fund factsheet on AMC website
- Morningstar/Value Research fund profiles
- SEBI fund documents
6. Fund Size (AUM - Assets Under Management)
Ideal AUM Range:
Equity Funds: Rs 300 Cr - Rs 3,000 Cr
- Too small: Risk of fund closure
- Too large: Difficult to deploy capital efficiently
- Sweet spot: Rs 500 Cr - Rs 2,000 Cr

Debt Funds: Rs 500 Cr - Rs 5,000 Cr
- Higher AUM is generally safer for stability

New Funds: Watch out if AUM < Rs 50 Cr
- May be closed if they don't gain traction
Why AUM Matters:
- Fund closure = Forced redemption at potentially unfavorable times
- Very large AUM = Slower decision-making, harder to outperform
- Adequate AUM = Operational stability and efficiency
7. Exit Load
Definition: Fee charged when you redeem/sell units before specified period
Exit Load Structure:
Example: Equity Fund with 1-year exit load of 1%

Units Held | Exit Load | On Rs 1,00,000 investment
< 1 year   | 1%        | Rs 1,000 deducted
> 1 year   | Nil       | No deduction
Key Points:
- Most equity funds: 1% exit load if redeemed within 1 year
- Debt funds: Usually no exit load
- ELSS: 3-year lock-in period (no exit allowed)
- Check the exit load before investing so it fits your expected holding period
- For shorter horizons, many investors prefer funds with low exit loads and no long lock-in (ELSS being a common exception)
Direct vs Regular Plans
Understanding the Difference
MUTUAL FUND STRUCTURE:

Regular Plan:
You → Distributor/Advisor → AMC
       (Charges 0.5-1% commission)

Direct Plan:
You → AMC (No intermediary)
Comparison Table
| Aspect | Direct Plan | Regular Plan |
|---|---|---|
| Expense Ratio | Lower (0.3-0.8%) | Higher (0.8-1.5%) |
| Net Returns | Higher by 0.5-0.7% annually | Lower by 0.5-0.7% annually |
| Who Buys | Self-directed investors | Through advisors |
| Access to Advice | None (self-directed) | Access to advisor guidance |
| Account Opening | Direct from AMC website | Via distributor/advisor |
| SIP Setup | Direct with AMC | Via distributor |
| Long-term Impact | Lower cost can meaningfully compound over time (illustrative) | Commission drag reduces net returns |
Why Many Long-Term Investors Prefer Direct Plans
20-Year Return Comparison (illustrative):
Initial Investment: Rs 1,00,000 (one-time) or Rs 5,000 monthly SIP

Scenario 1: Regular Plan (1.2% ER, 12% gross return = 10.8% net)
After 20 years: Rs 60,68,000

Scenario 2: Direct Plan (0.5% ER, 12% gross return = 11.5% net)
After 20 years: Rs 73,89,000

Advantage of Direct Plan: Rs 13,21,000 (21.8% more!)
A lower expense ratio quietly compounds into a large gap over a long holding period. The illustrative corpus on a one-time Rs 1,00,000 investment shows the spread:
Illustrative 20-Year Corpus: Direct vs Regular (Rs lakh)
Illustrative, assumes 12% gross return on Rs 1,00,000 one-time. Not a forecast.
When to Use Regular Plans?
- You need professional guidance and value the advisor's advice
- You're not tech-savvy and prefer personal assistance
- You need hand-holding for complex investment decisions
- If advisor charges are reasonable (under 0.5% annually)
Switching from Regular to Direct
Strategy:
- Open Direct Plan account with the same fund
- Don't liquidate regular plan immediately
- Check tax implications (capital gains?)
- Gradually shift via SIP contributions to direct plan
- Once capital gains are harvested (if any), switch completely
Active vs Passive Investing
Active Funds
Definition: Fund manager actively picks stocks to beat the benchmark
Characteristics:
- Higher expense ratio (0.5-1.5%)
- Manager tries to "beat the market"
- Performance varies significantly
- Requires skilled fund manager
Pros:
- Potential to beat benchmark
- Flexibility in allocation
- Can adapt to market conditions
Cons:
- Higher costs reduce returns
- Manager skill varies
- Often underperform passively over long periods
Best For: Emerging markets, small-cap, sector-specific investments
Passive Funds (Index Funds & ETFs)
Definition: Replicate index performance (e.g., Sensex, Nifty)
Popular Indices:
Equity Indices:
- Nifty 50 (Large-cap)
- Sensex 50 (Large-cap, BSE)
- Nifty Midcap 100 (Mid-cap)
- Nifty 100 or 200 (Diversified)
- Nifty Next 50 (emerging large-caps)

International Indices:
- Nifty US 100
- Nifty Global 100
Characteristics:
- Very low expense ratio (0.1-0.4%)
- Returns match benchmark (minus fees)
- Consistent, predictable performance
- Lower portfolio turnover
Pros:
- Lowest costs
- Consistent performance
- No manager risk
- Transparent holdings
Cons:
- Cannot beat benchmark
- Only match index returns
- Less flexibility
Best For: Core portfolio holdings, large-cap equity
Index Funds vs ETFs
| Aspect | Index Fund | ETF |
|---|---|---|
| How to Buy | AMC directly (like mutual funds) | Stock exchange (like shares) |
| Trading Hours | NAV updated once daily | Real-time pricing, intra-day trading |
| Purchase Method | Buy from AMC | Buy from stock market |
| Flexibility | Good | Excellent (intra-day trading) |
| Minimum Investment | Rs 500-1,000 | 1 unit (varies, Rs 30,000-50,000+) |
| Expense Ratio | 0.1-0.3% | 0.1-0.25% (even lower) |
| Tax Efficiency | Good | Excellent (lower turnover) |
Active vs Passive: The Evidence
Statistical Research:
Over 20-year period (2002-2022):

Large-cap Active Funds:
- Only 25% beat the index consistently
- Average underperformance vs index: 0.8-1.2% annually

Mid/Small-cap Active Funds:
- 35-40% beat the index (higher opportunity)
- Average outperformance when they win: 2-3% annually

Conclusion:
- For large-cap: Use passive (index funds/ETFs)
- For mid/small-cap: Can use active (better skilled managers)
- For debt: Use active (better manager selection matters)
Recommended Approach: Core + Satellite
Core (70%): Passive Index Funds
├─ 40% Nifty 50 or Sensex 50 ETF
├─ 20% Nifty Midcap 100 ETF
├─ 10% International (Nifty Global 100)

Satellite (30%): Active Funds
├─ 15% Mid-cap Active Fund (skilled manager)
├─ 10% Small-cap Active Fund (with conviction)
├─ 5% Sector/Thematic Fund (tactical bet)
SIP Strategy Guide
What is SIP?
Definition: Systematic Investment Plan - Investing fixed amount at regular intervals
Mechanics:
Example: Monthly SIP of Rs 5,000 in Equity Fund

Month 1: NAV = Rs 100, Units purchased = 50
Month 2: NAV = Rs 95, Units purchased = 52.63
Month 3: NAV = Rs 105, Units purchased = 47.62
...and so on
Benefit: Rupee Cost Averaging - You buy more units when prices are low, fewer when high
How Much Should You Invest?
The 50-30-20 Rule (For regular income earners):
After-Tax Income = 100%
├─ Essential Expenses: 50%
├─ Savings/Investments: 30%
└─ Lifestyle/Discretionary: 20%

For NRIs with varying income:
├─ Minimum: 10% of monthly income
├─ Ideal: 20-30% of monthly income
└─ Aggressive: 40%+ (if high income and low expenses)
Calculation Examples:
Scenario 1: Monthly Salary Rs 1,00,000
Annual Expenses: Rs 50,00,000
Available for Investment: Rs 30,00,000 annually
Monthly SIP: Rs 2,50,000

Scenario 2: NRI with Variable Income
Average Monthly Income: Rs 2,00,000
Investment Target: 25% = Rs 50,000
Monthly SIP: Rs 50,000
Can increase in good months, reduce in lean months
Rule of Thumb:
- Invest the maximum you can comfortably afford without impacting lifestyle
- Better to invest Rs 5,000 consistently than Rs 20,000 for 2 months only
- Consistency matters more than amount
When Should You Start a SIP?
The Simple Answer: RIGHT NOW!
Why Earlier is Better:
Scenario: Rs 5,000 monthly SIP, 12% annual returns

Start at Age 25:
After 20 years (Age 45): Rs 35,75,000

Start at Age 35:
After 20 years (Age 55): Rs 17,87,500

Difference: Rs 17,87,500 (100% more!)

Benefits of early start:
- More time for compounding
- Can increase SIP as income grows
- Less burden on future earnings
- Develop investing discipline
Action Plan:
- Start today (even with Rs 1,000 if tight on budget)
- Automate SIP (bank auto-debit on fixed date)
- Increase SIP amount yearly (Step-up SIP) as income grows
When Should You Stop a SIP?
Scenarios:
Scenario 1: Reached Investment Goal
├─ Stop SIP immediately
├─ Let existing investments grow
└─ Withdraw only when needed

Scenario 2: Approaching Investment Timeline
Example: Child's education in 2 years
├─ Stop equity SIP 12 months before
├─ Shift to debt funds
└─ Move to safe funds 3-6 months before need

Scenario 3: Job Loss / Income Disruption
├─ Pause SIP (not stop)
├─ Resume when income stabilizes
└─ Don't panic-sell existing investments

Scenario 4: Fund Underperformance
├─ DON'T stop immediately
├─ Review in 2-3 years
├─ If consistently underperforming, switch
└─ Never exit in panic

Scenario 5: Reaching Retirement
├─ Shift to balanced/debt funds gradually
├─ Begin systematic withdrawals
└─ Maintain some growth portfolio for longevity
Never Stop SIP Because:
- Market is down (this is the best time!)
- Fund performance dipped temporarily (needs 2-3 year review)
- You're emotionally frustrated (short-term noise)
- A neighbor suggests it (ignore unsolicited advice)
Step-Up SIP (Increasing SIP Over Time)
What is Step-Up SIP? Increase your SIP amount at regular intervals as your income grows
Implementation:
Year 1-3: Rs 5,000 monthly
Year 4-6: Rs 7,500 monthly (50% increase)
Year 7-9: Rs 10,000 monthly (33% increase)
Year 10+: Rs 15,000 monthly (50% increase)

Impact of Step-Up SIP:
Regular SIP (Rs 5,000 fixed for 20 years): Rs 35,75,000
Step-Up SIP (increased 10% annually): Rs 65,42,000

Difference: Rs 29,67,000 (83% more!)
Best Practice:
- Increase SIP when you get salary hike
- Increase by 10-20% annually
- Use bonuses/extra income for additional lump-sum investments
- Automate the increase with your AMC
Lumpsum vs SIP Comparison
Understanding Lumpsum Investing
Definition: Investing entire amount at once
Scenario Example:
You receive gift of Rs 5,00,000
Investment Option 1: Invest all today
Investment Option 2: Invest Rs 50,000 monthly for 10 months (SIP)
Head-to-Head Comparison
| Factor | Lumpsum | SIP |
|---|---|---|
| Entry Timing | All at once | Spread over time |
| Rupee Cost Averaging | None | Strong benefit |
| Risk | Higher (may invest at peak) | Lower (spread risk) |
| Returns Potential | Higher if market goes up | More stable, consistent |
| Psychological Comfort | Lower (larger initial risk) | Higher (regular investment) |
| Liquidity Impact | Immediate market exposure | Gradual market exposure |
| Best Used When | Market down, confident timing | Uncertain market, regular income |
Returns Comparison (Historical Data)
20-year analysis (2004-2024): Nifty 50 Index

Lumpsum Approach:
If invested at absolute low points: 14.2% CAGR
If invested at absolute high points: 11.8% CAGR
Average (invested at random times): 12.5% CAGR

SIP Approach (Rs 10,000 monthly):
Regardless of timing: 12.1% CAGR
Standard deviation: 0.3% (very consistent)

Conclusion: Lumpsum can give higher returns IF you have
perfect timing (impossible), but SIP gives nearly same
returns with much lower timing risk.
Decision Framework
Do you have a lumpsum to invest?
│
├─ YES
│  │
│  ├─ Is the market at historical lows? (Check P/E ratio < 15)
│  │  ├─ YES: Invest lumpsum now (higher returns expected)
│  │  └─ NO: Split lumpsum into monthly SIP (reduce risk)
│  │
│  ├─ Are you uncertain about market direction?
│  │  ├─ YES: Use SIP for 6-12 months
│  │  └─ NO: Can invest lumpsum
│  │
│  └─ How comfortable are you with volatility?
│     ├─ Very comfortable: Invest lumpsum
│     └─ Not comfortable: Use 6-12 month SIP
│
└─ NO: Use monthly SIP from salary/income
Optimal Strategy: Hybrid Approach
If you have regular income + occasional lumpsum:
Monthly Income: Rs 1,00,000
├─ SIP Investment: Rs 30,000 (30% of income)
└─ Continue regularly

Occasional Lumpsum (Bonus, Tax Refund, Inheritance):
├─ Amount < Rs 5,00,000: Invest as lumpsum immediately
├─ Amount Rs 5,00,000 - 15,00,000: 50-50 split (lumpsum + SIP)
└─ Amount > Rs 15,00,000: Invest over 6-12 months via SIP
Portfolio Construction
The Core + Satellite Approach
Concept: Combine stability (core) with growth opportunities (satellite)
Total Portfolio = Core Holdings (70%) + Satellite Holdings (30%)

CORE HOLDINGS (70%):
Purpose: Stability, consistent returns, foundation
├─ 40% Large-cap Index Fund (Nifty 50 ETF)
├─ 20% Balanced Hybrid Fund
└─ 10% Debt/Fixed Income

SATELLITE HOLDINGS (30%):
Purpose: Growth, outperformance, conviction bets
├─ 15% Mid-cap Active Fund
├─ 10% Small-cap Fund
└─ 5% International/Sector Fund
Diversification Across Categories
Never Concentrate Too Much:
Example of POOR diversification:
Portfolio of Rs 10 lakhs:
├─ Axis Equity Fund: Rs 2.5 lakhs
├─ HDFC Equity Fund: Rs 2.5 lakhs
├─ ICICI Equity Fund: Rs 2.5 lakhs
└─ HDFC Balanced: Rs 2.5 lakhs

Problem: All funds invest in same large-cap stocks!
You have 4 funds but NOT diversified.

Example of GOOD diversification:
Portfolio of Rs 10 lakhs:
├─ Nifty 50 Index Fund: Rs 3 lakhs (large-cap)
├─ Nifty Midcap 100 Index: Rs 2 lakhs (mid-cap)
├─ Small-cap Active Fund: Rs 1.5 lakhs (small-cap)
├─ International Fund: Rs 1.5 lakhs (overseas)
├─ Debt Fund: Rs 1.5 lakhs (stability)
└─ Gold Fund: Rs 0.5 lakhs (inflation hedge)

Benefit: True diversification across cap sizes,
geographies, and asset classes
How Many Funds Should You Own?
The Ideal Number: 5-7 Funds
MINIMUM Portfolio (3 funds):
├─ Large-cap: 40% - HDFC Top 100 or Nifty 50 Index
├─ Mid/Small-cap: 40% - Midcap Fund + Small-cap Fund (combine)
└─ Debt: 20% - Balanced Fund or Debt Fund

IDEAL Portfolio (5-7 funds):
├─ Large-cap: 30% - Index Fund
├─ Mid-cap: 20% - Active Fund
├─ Small-cap: 15% - Active Fund
├─ International: 15% - Global Fund
├─ Debt: 15% - Debt Fund
├─ Gold: 5% - Gold Fund (optional)
└─ Alternative: 5% - Emerging fund/Sector (optional)

MAXIMUM: 8-10 funds (Any more = Over-complication)
Why Not Too Many Funds?
Challenges with 20+ Funds:
├─ Difficult to track performance
├─ Overlapping holdings (redundancy)
├─ Over-diversification reduces outperformance
├─ Increased paperwork and taxes
├─ Psychological burden
└─ No added benefit

5-7 Funds Sweet Spot:
├─ Easy to manage and monitor
├─ True diversification benefit
├─ Optimal complexity vs return tradeoff
├─ Manageable tax reporting
└─ Focused portfolio
Sample Portfolio Construction Process
Step 1: Define Your Goals (1-Year, 5-Year, 10-Year)
1-Year Goals: Rs 2,00,000 (Home renovation)
5-Year Goals: Rs 10,00,000 (Car purchase)
10-Year Goals: Rs 20,00,000 (Second home down payment)
20-Year+ Goals: Rs 1,00,00,000 (Retirement)
Step 2: Allocate by Time Horizon
Money for 1-year goal:
├─ 100% in Liquid Funds or Short-duration Debt Funds

Money for 5-year goal:
├─ 30% Equity (Large-cap Index Fund)
├─ 70% Debt (Short-duration Fund)

Money for 10-year goal:
├─ 70% Equity (40% Large-cap + 30% Mid/Small-cap)
├─ 25% Debt (Balanced or Medium Duration)
└─ 5% Gold/International

Money for 20+ year goal (Retirement):
├─ 80% Equity (40% Large-cap + 25% Mid-cap + 15% International)
├─ 15% Debt (Long-duration or Balanced)
└─ 5% Gold/Alternative
Step 3: Select Specific Funds
For Equity allocation:
Large-cap (40% of equity): Nifty 50 ETF or Large-cap Index Fund
Mid-cap (30% of equity): Mid-cap Active Fund or Nifty Midcap 100
Small-cap (20% of equity): Small-cap Active Fund
International (10% of equity): Nifty Global 100 ETF or International Fund
For Debt allocation:
Short-duration needs: Liquid Fund or Ultra-short Duration
Medium-term needs: Short Duration Fund or Conservative Hybrid
Long-term allocation: Medium Duration or Credit Fund
Step 4: Calculate Monthly SIP
10-Year Goal: Rs 10,00,000
Expected Return: 10% annually
Monthly SIP Required: Rs 5,820

5-Year Goal: Rs 5,00,000
Expected Return: 8% annually
Monthly SIP Required: Rs 7,020

20-Year Retirement: Rs 1,00,00,000
Expected Return: 10% annually
Monthly SIP Required: Rs 9,646
Rebalancing Strategy
What is Rebalancing?
Definition: Periodically adjusting portfolio back to target allocation
Example:
Target Allocation:
├─ Equity: 60%
└─ Debt: 40%

Initial Investment (Rs 10,00,000):
├─ Equity Fund: Rs 6,00,000
└─ Debt Fund: Rs 4,00,000

After 1 year (Equity grows faster):
├─ Equity Fund: Rs 7,20,000 (70%)
└─ Debt Fund: Rs 4,10,000 (30%)

Rebalancing Action:
├─ Sell Rs 60,000 from Equity → Rs 6,60,000
└─ Buy Rs 60,000 in Debt → Rs 4,70,000

New Allocation:
├─ Equity: 60% ✓
└─ Debt: 40% ✓
Why Rebalance?
Benefits:
-
Risk Management: Prevents portfolio from becoming too risky
Over-leveraged portfolio (80% equity): 10% market crash = 8% portfolio loss -
Lock in Gains: Sells winners at peak
Rebalancing = "Buy low, sell high" systematically -
Emotional Discipline: Removes emotion from decisions
Hard to sell winners emotionally Rebalancing forces disciplined execution -
Consistent Returns: Maintains planned risk profile
Portfolio drifts = Unintended risk changes
When to Rebalance?
Option 1: Time-Based Rebalancing (Recommended)
- Rebalance once per year (December/March)
- Simple to remember and execute
- Works well for long-term investors
Option 2: Threshold-Based Rebalancing
- When allocation drifts > 5-10% from target
Example:
Target Equity: 60%
Current Equity: 65% (or above)
Action: Rebalance to 60%

This prevents overweighting while not being too frequent
Option 3: Event-Based Rebalancing
- After significant market moves (>20%)
- After major life events (bonus, job change)
- When taking major withdrawals
How to Rebalance
Step-by-Step Process:
1. Calculate Current Allocation %
   Total Portfolio Value: Rs 15,00,000
   ├─ Equity Funds: Rs 10,50,000 (70%)
   └─ Debt Funds: Rs 4,50,000 (30%)

2. Determine Target Allocation
   Target:
   ├─ Equity: 60% = Rs 9,00,000
   └─ Debt: 40% = Rs 6,00,000

3. Calculate Rebalancing Actions
   Equity: Over by Rs 1,50,000
   Debt: Under by Rs 1,50,000

   Action: Sell Rs 1,50,000 Equity, Buy Debt with proceeds

4. Execute in Tax-Efficient Manner
   ├─ Harvest losses first (if any)
   ├─ Use new investments to rebalance (don't liquidate if possible)
   └─ Consider tax implications before selling gains

5. Document and Review
   ├─ Record new allocation
   ├─ Set reminder for next rebalancing (1 year)
   └─ Review for any major drifts (quarterly)
Tax-Efficient Rebalancing
Strategy:
Scenario: Annual Rebalancing Due

Method 1: Sell Equity, Buy Debt (Triggers Tax)
├─ Equity Units Sold: Rs 1,50,000
├─ Capital Gains Tax: Rs 20,000-30,000
└─ After-tax proceeds: Rs 1,20,000-1,30,000 less

Method 2: Use New Investments (Tax-Efficient)
├─ Monthly SIP: Rs 10,000
├─ All SIP for 15 months goes to Debt Funds
├─ Rebalances portfolio without triggering tax
└─ No capital gains tax paid

Recommendation: Use Method 2 whenever possible
Exception: If portfolio has significant losses, rebalancing may harvest tax losses (beneficial)
Red Flags and Exit Strategies
When to Exit a Fund
Red Flag 1: Fund Manager Change
Action Required:
├─ Fund Manager Change: Monitor for 6-12 months
├─ If performance dips: Evaluate for exit
├─ Check new manager's track record
└─ Don't panic-exit immediately
Red Flag 2: Significant Underperformance
Evaluation Criteria (3-5 year horizon):

Underperformance Check:
├─ Compare vs category benchmark
├─ Allow 2-3 year review period
├─ Check peer fund performance in category
└─ Evaluate Sharpe ratio (risk-adjusted)

Action:
├─ Underperformance 1-2 years: Monitor
├─ Underperformance 3+ years: Consider exit
├─ Underperformance vs peers consistently: Exit
Red Flag 3: Rising Expense Ratio
Observation: ER increased from 0.8% to 1.2% in 2 years

Analysis:
├─ ERs shouldn't increase unless restructured
├─ Increasing ER = Lower net returns
├─ Look for better alternatives

Action: Switch to fund with stable lower ER
Red Flag 4: Declining Fund Size
Observation: AUM dropped from Rs 800 Cr to Rs 200 Cr

Risk:
├─ Fund approaching closure risk
├─ May affect fund operations
├─ Forced redemption if closure happens

Action: Evaluate alternative funds
Switch if AUM < Rs 100 Cr
Red Flag 5: Sudden Change in Investment Style
Example: Large-cap fund suddenly buying 40% mid-cap stocks

Risk:
├─ Portfolio drifting from stated objective
├─ Manager style changed without disclosure
├─ Potential increased risk

Action:
├─ Read latest fund factsheet
├─ Compare holdings with historical data
├─ Exit if style drift inconsistent with goals
Exit Decision Framework
Should I Exit This Fund?

Step 1: Has fund underperformed for 3+ years?
├─ YES → Check if consistent issue
│        ├─ YES → Proceed to Step 2
│        └─ NO → Monitor
└─ NO → Keep holding

Step 2: Has fund underperformed peers by > 2% annually?
├─ YES → Proceed to Step 3
└─ NO → Keep holding (likely temporary dip)

Step 3: Have fund manager/strategy/size changed materially?
├─ YES → Proceed to Step 4
└─ NO → Reconsider (maybe market cycle issue)

Step 4: Have capital gains become significant?
├─ YES → Evaluate tax cost vs fund quality
│        ├─ Tax cost < 15%: Exit
│        └─ Tax cost > 30%: Reconsider
└─ NO → Exit and switch

Step 5: Are there better alternatives available?
├─ YES → Switch to better fund
└─ NO → Hold (patience pays off)
How to Exit (Minimizing Tax)
Tax Loss Harvesting:
Scenario: Fund A has 15% gain, Fund B has 10% loss

Action:
1. Sell Fund B (realize loss = -10%)
2. Buy similar fund (sets off loss against gains)
3. Sell Fund A gradually over 2-3 months

Result: Losses offset gains, reduced tax
Exit Load Consideration:
Fund has 1% exit load if exited within 1 year

Calculation:
Investment value: Rs 1,00,000
Gain in 1 year: Rs 10,000
Total value: Rs 1,10,000

Exit Load (1%): Rs 1,100
Post-exit proceeds: Rs 1,08,900

Still worth exiting if:
├─ Moving to significantly better fund
├─ Fund is performing poorly
└─ Your situation has changed
Avoid Exit Triggers:
- Don't exit due to short-term performance (1-year dips are normal)
- Don't exit because of market downturns (best time to stay invested)
- Don't exit because friend's fund is doing better (different risk profiles)
- Don't exit emotionally (always use framework above)
Sample Portfolios
Conservative Portfolio
Profile: Risk-averse, near-term goals, capital preservation priority Age Profile: 55+, Near Retirement, Low risk tolerance Time Horizon: 1-5 years for major needs
Portfolio Allocation:
ALLOCATION BREAKDOWN:
├─ Debt: 60%
├─ Equity: 30%
├─ Gold/Alternative: 10%

SPECIFIC HOLDINGS (Rs 10,00,000):
├─ Liquid Fund: Rs 2,00,000 (Emergency fund)
├─ Short Duration Debt: Rs 2,50,000 (Safety)
├─ Conservative Hybrid: Rs 1,50,000 (Balanced)
├─ Large-cap Index Fund: Rs 2,00,000 (Stable equity)
├─ Mid-cap Equity (Conservative): Rs 1,00,000 (Growth)
└─ Gold Fund: Rs 1,00,000 (Inflation hedge)
Fund Category Selection (illustrative example, not a recommendation):
├─ Liquid Fund: a low-cost liquid fund
├─ Short Duration Debt: a short-duration debt fund
├─ Conservative Hybrid: a conservative hybrid fund
├─ Large-cap Equity: a Nifty 50 index fund
├─ Mid-cap Equity: a moderate-risk mid-cap fund
└─ Gold: a gold fund or gold ETF
Expected Returns: 7-8% annually Volatility: Low Rebalancing: Annually (December)
Balanced Portfolio
Profile: Moderate risk tolerance, long-term horizon (10+ years), regular income Age Profile: 30-45 years, Mid-career Time Horizon: 10-20 years
Portfolio Allocation:
ALLOCATION BREAKDOWN:
├─ Equity: 60%
├─ Debt: 30%
├─ Gold/Alternative: 10%

SPECIFIC HOLDINGS (Rs 10,00,000):
├─ Nifty 50 Index Fund: Rs 3,00,000 (Core large-cap)
├─ Nifty Midcap 100 Index: Rs 1,50,000 (Mid-cap exposure)
├─ Small-cap Active Fund: Rs 1,00,000 (Growth potential)
├─ International Fund (Nifty Global): Rs 1,00,000 (Diversification)
├─ Balanced Hybrid: Rs 2,00,000 (Stability + some growth)
├─ Short/Medium Duration Debt: Rs 1,00,000 (Safety)
└─ Gold ETF: Rs 0,50,000 (Inflation hedge)
Mapped to fund type, the same Rs 10,00,000 balanced portfolio splits across six sleeves — diversified by cap size, geography, and asset class:
Balanced Portfolio Allocation by Fund Type (Rs lakh)
Illustrative allocation on Rs 10,00,000. Not a recommendation.
Fund Category Selection (illustrative example, not a recommendation):
├─ Large-cap: a Nifty 50 ETF or index fund
├─ Mid-cap: a mid-cap index or active fund
├─ Small-cap: a small-cap fund
├─ International: a global/international index fund or ETF
├─ Balanced: a balanced/hybrid fund
├─ Debt: a debt fund or fixed deposit ladder
└─ Gold: a gold ETF (typically lower cost than a gold fund)
Expected Returns: 10-12% annually Volatility: Moderate Investment Strategy:
- Core SIP: Rs 10,000 monthly in Index Funds
- Tactical: Lumpsum in small-cap/international when opportunities arise
- Rebalancing: Annually or when allocation drifts > 5%
Aggressive Portfolio
Profile: High risk tolerance, long-term horizon (15+ years), can handle volatility Age Profile: 25-40 years, High income stability Time Horizon: 15-30 years
Portfolio Allocation:
ALLOCATION BREAKDOWN:
├─ Equity: 80%
├─ Debt: 15%
├─ Alternative/Tactical: 5%

SPECIFIC HOLDINGS (Rs 10,00,000):
├─ Nifty 50 Index Fund: Rs 2,50,000 (Core stability)
├─ Nifty Midcap 100 Index: Rs 2,00,000 (Mid-cap growth)
├─ Small-cap Active Fund: Rs 1,50,000 (High growth potential)
├─ Mid-cap Active Fund: Rs 1,00,000 (Additional quality check)
├─ International Fund: Rs 1,00,000 (Geographic diversification)
├─ Balanced Fund: Rs 1,00,000 (Rebalancing buffer)
├─ Gold Fund: Rs 0,50,000 (Inflation hedge)
└─ Sectoral/Emerging Fund: Rs 0,50,000 (Tactical bets)
Fund Category Selection (illustrative example, not a recommendation):
Equity Core (60%):
├─ Nifty 50 Index Fund (40%)
├─ Nifty Midcap 100 (20%)

Growth & Opportunity (20%):
├─ Small-cap: a small-cap fund
├─ Mid-cap Focused: a focused or value fund

Diversification (15%):
├─ International: an emerging-markets or global fund

Stability (5%):
├─ Debt or gold funds
Expected Returns: 12-15% annually Volatility: High (25-30% in bad years) Investment Strategy:
- Core SIP: Rs 15,000-20,000 monthly
- Aggressive: Increase to 40-50% allocation in market downturns
- International: Maintain for currency diversification
- Tactical: Use bonus/lumpsum for sector bets
Risk Management:
- Review quarterly but rebalance only annually
- Don't panic sell during 30%+ downturns (expected in aggressive portfolio)
- Have emergency fund in separate liquid fund (6 months expenses)
NRI-Specific Considerations in Portfolios
Additional Factors for NRIs:
-
Currency Risk
Benefit: International funds provide USD hedge Risk: INR depreciation affects returns Strategy: 15-20% in international funds -
Remittance Strategy
Large remittances: Spread via SIP (dollar-cost averaging) Regular salary: Direct to investing, don't time market Portfolio size: Account for periodic INR conversions -
Tax Planning
LTCG Tax (Equity): 20% with indexation benefit STCG Tax (Equity): As per slab rate TDS on remittances: Plan for tax on foreign income Dividend income: TDS applicable -
Repatriation Needs
Future overseas education: 40% debt funds
Overseas property purchase: International funds
Retirement to abroad: Maintain liquid international assets
Frequently Asked Questions
Investment Fundamentals
Q1: How much should I invest monthly as a NRI?
A: Use the 50-30-20 rule:
- Essential expenses: 50% of after-tax income
- Savings/Investments: 30% of after-tax income
- Discretionary: 20%
For NRIs with variable income, minimum Rs 5,000-10,000 monthly is good. Maximum should be amount you won't need for 3-5 years.
Q2: Should I invest lumpsum or SIP?
A:
- SIP is better for: Uncertain market outlook, regular income, building discipline, risk aversion
- Lumpsum is better for: Market at historical lows (P/E < 15), large inheritance, one-time bonus
- Best approach: SIP as base + lumpsum when market is down
Q3: Is it better to invest in India or international funds?
A: Ideal is 70-80% India, 20-30% international:
- India: Higher growth potential, better market knowledge, lower cost
- International: Currency hedge, diversification, developed market stability
- Recommendation: Core holding in India, 15-20% international for diversification
Fund Selection
Q4: How do I choose between 10 good funds?
A: Use this priority order:
- Lowest Expense Ratio (same category, reduce cost drag)
- Better Sharpe Ratio (risk-adjusted returns)
- Longer track record (5+ years preferred)
- Better fund manager (5+ years tenure)
- Adequate AUM (Rs 300 Cr minimum)
Q5: Direct or Regular plans - is the difference really that significant?
A: It can be meaningful over long horizons:
20-year impact example (illustrative, assumes 12% gross return; not a forecast):
Regular Plan (1.2% ER): Rs 60,68,000
Direct Plan (0.5% ER): Rs 73,89,000
Difference: Rs 13,21,000 (21.8% more)
Because of this cost difference, many self-directed long-term investors prefer Direct plans. Regular plans can still make sense when you value advisor guidance and the cost of that advice is justified for your situation.
Q6: How many funds should I own?
A: Ideal is 5-7 funds:
- Less than 5: Insufficient diversification
- 5-7: Optimal balance of diversification and manageability
- More than 10: Over-complication, tracking burden, redundancy
Q7: Index funds or active funds?
A:
- 70% Index (Core): Large-cap for consistency
- 30% Active (Satellite): Mid/small-cap for growth opportunities
- Why: Research shows only 25% of active large-cap managers beat index consistently
SIP and Investment Timing
Q8: When should I start SIP?
A: Today. The best time to plant a tree was 20 years ago, the second best is today.
- Even Rs 1,000/month is better than waiting
- Time in market beats timing market
- Early start compounds dramatically
Q9: Should I stop SIP when market is crashing?
A: Absolutely NOT. This is when you should celebrate:
Market crash (30% fall):
- SIP Rs 5,000 buys 30% more units
- When market recovers, these units are worth much more
- Panic-exiting locks in losses permanently
Best investors buy when others panic.
Q10: How do I increase my SIP amount?
A: Follow Step-up SIP:
- Increase by 10-20% annually when salary increases
- Align with promotion/bonus periods
- Automate the increase with your AMC
- This dramatically increases corpus over time
Portfolio Management
Q11: How often should I check my portfolio?
A:
- Check quarterly: Review performance, verify holdings
- Act once yearly: Annual rebalancing in March/December
- Never check daily/weekly: This leads to emotional decisions
- Avoid news/media: Market news creates unnecessary worry
Q12: When should I rebalance?
A: Once per year (December/March):
- Check current vs target allocation
- If drift > 5%, rebalance
- Use new investments if possible (avoid taxable sales)
- Harvest losses first (set off gains)
Q13: How do I know if my fund is performing well?
A: Compare against category benchmark:
Your Large-cap Fund: 11% return
Nifty 50 Benchmark: 12% return
Your underperformance: 1%

Acceptable if:
├─ Underperformance < 1% annually
├─ Sharpe ratio better than benchmark
└─ Manager has been consistent
Allow 2-3 year evaluation period (1-year data is noise).
Risk and Safety
Q14: How safe are mutual funds?
A: Very safe:
- SEBI regulated: Strict oversight and compliance
- Asset segregation: Your units belong to you, not AMC
- Professional custody: HDFC Bank, ICICI Bank hold assets
- Fund closure: Redeemed at NAV, not forced loss
- Only risk: Investment risk (market fluctuations), not credibility risk
Q15: What should be my emergency fund?
A: Maintain 6-12 months of expenses in liquid funds:
Monthly expenses: Rs 50,000
Emergency Fund: Rs 3,00,000 - 6,00,000

Investment: Liquid Fund (6-7% returns, instant access)
├─ 3 months: Rs 1,50,000 in primary liquid fund
├─ 3-6 months: Rs 1,50,000-3,00,000 in backup fund
└─ 6-12 months: Could be debt fund (7-8% returns)
Taxes and Returns
Q16: How are mutual fund returns taxed?
A: Equity Funds (held > 1 year):
- Long-term Capital Gains Tax: 20% with indexation benefit
- Effective tax: 12-15% depending on inflation
Equity Funds (held ≤ 1 year):
- Short-term Capital Gains Tax: Slab rate (30-40%)
Debt Funds (held > 3 years):
- LTCG: 20% with indexation benefit
- Effective tax: 5-10%
Debt Funds (held ≤ 3 years):
- As per slab rate (30-40%)
Q17: Should I invest in ELSS for tax saving?
A: Yes, if you need Section 80C deduction:
- Tax saving: Rs 1,46,250 deduction = Rs 44,000-58,000 tax save
- Lock-in: 3 years (not freely liquid)
- Returns: Equity fund returns (higher growth potential)
- Tip: Invest in first month of financial year (9 more months growth)
NRI-Specific Questions
Q18: As NRI, can I invest in mutual funds?
A: Yes, fully allowed:
- Resident NRI: Full market access
- Non-resident NRI: Allowed, some restrictions on funds
- Account opening: Online, simple paperwork
- KYC: Can complete online
- Taxation: As per tax treaty between India and your country
Q19: How should I handle rupee remittances and invest?
A: Strategy:
- Large Remittance (> Rs 10 lakhs): Spread via SIP over 6-12 months (rupee cost averaging)
- Regular Salary: Don't wait for "right price" - invest monthly via SIP
- Bonus/Tax Refund: Can invest immediately if large opportunity
- Currency: Benefit from rupee fluctuations naturally through SIP timing
Q20: Should international funds be in India or NRI country?
A: Prefer India-based international funds:
- Lower cost: 0.8-1.5% vs 1.5-2.5% in foreign funds
- Tax efficient: Managed by Indian fund houses
- Easier withdrawal: Repatriate when needed
- Single ecosystem: All investments in one place
Common Mistakes to Avoid
Q21: What are the most common mutual fund mistakes?
A:
- Chasing recent returns → Don't buy funds just because they did well last year
- Not understanding holdings → Know what your fund invests in
- Too many funds → Creates redundancy and complexity
- Panic selling in downturns → Lock in losses permanently
- Not rebalancing → Portfolio drifts off target risk
- Comparing different risk profiles → Compare within same category
- Overlooking plan cost → For self-directed investors, Direct plans often cost less over time
- Not automating SIP → Manual investing leads to gaps
- Timing the market → Impossible; SIP is better
- Ignoring expense ratios → Huge impact over time
Q22: When should I completely avoid a fund?
A:
- Red Flag 1: Fund size < Rs 50 Cr (closure risk)
- Red Flag 2: ER > 2% without exceptional performance
- Red Flag 3: New fund with unproven manager
- Red Flag 4: Consistent underperformance vs benchmark > 2% p.a. for 3+ years
- Red Flag 5: Fund manager change + style drift
- Red Flag 6: Conflicted fund (part of larger bank that benefits its own products)
Action Plan: Getting Started Today
Week 1: Planning Phase
[ ] Step 1: List your financial goals and time horizons
    Example: Retirement (20 years), Child education (8 years), Home down payment (4 years)

[ ] Step 2: Calculate available investment amount
    Monthly income: Rs ___________
    Monthly expenses: Rs ___________
    Available for investment (30% of surplus): Rs ___________

[ ] Step 3: Assess risk tolerance
    Take the 4-question risk assessment above
    Identify: Conservative / Balanced / Aggressive

[ ] Step 4: Download required documents
    - Pan Card scan
    - Bank account details
    - Address proof
    - Passport (for NRIs)
    - Income documentation
Week 2: Research and Selection
[ ] Step 5: Shortlist funds in your category
    Use these websites:
    - MorningstarIndia.com
    - Value Research Online
    - SEBI Mutual Fund database
    - Individual AMC websites

[ ] Step 6: Compare your shortlist
    Create comparison table with:
    - 5-year CAGR return
    - Expense Ratio
    - Sharpe Ratio
    - Fund Manager tenure
    - AUM (size)

[ ] Step 7: Finalize 5-7 funds
    Select best funds in each category
    Aim for mix of index (core) and active (satellite)

[ ] Step 8: Calculate SIP amounts
    Total investment needed divided by number of funds
    Example: Rs 15,000 total ÷ 5 funds = Rs 3,000 per fund
Week 3: Account Opening
[ ] Step 9: Open accounts with selected AMCs
    For 5-7 funds, open accounts with 2-3 AMCs
    (Most AMCs offer 5+ funds each)

    Popular AMCs for global Indians:
    - HDFC Mutual Fund (largest, most schemes)
    - ICICI Prudential (strong offerings)
    - Axis Mutual Fund (good mid/small-cap)
    - SBI Mutual Fund (large index fund options)
    - Aditya Birla Sun Life (good range)

[ ] Step 10: Complete KYC
    Online process takes 15-30 minutes
    Upload documents digitally

[ ] Step 11: Link bank account
    Add your NRI/Savings account for transactions
    Verify bank details

[ ] Step 12: Set up auto-debit for SIP
    Schedule monthly debit on fixed date
    (Around salary date is ideal)
Week 4: Execution
[ ] Step 13: Make first investments
    Start with lumpsum if available
    Or begin monthly SIP

    Don't worry about "right price"
    - If market is high: More SIP duration will average it out
    - If market is low: Excellent buying opportunity
    - Time in market beats timing market

[ ] Step 14: Document your portfolio
    Create simple spreadsheet:
    - Fund name, category, amount invested
    - Investment date, monthly SIP amount
    - Expected target amount and timeline
    - Fund performance tracking (quarterly check)

[ ] Step 15: Set calendar reminders
    - Quarterly: Check portfolio (May, August, November, February)
    - Annually: Full review and rebalancing (December)
    - Annually: Review if SIP increase needed (January/after appraisal)

[ ] Step 16: Commit to the process
    - Don't check portfolio daily
    - Don't panic in market downturns
    - Don't chase performance
    - Stay disciplined with SIP
    - Remain invested for full time horizon
Conclusion
Building a successful mutual fund portfolio is not complicated, but it does require:
- Clear Goal Setting: Know exactly what you're investing for
- Discipline: Stick to monthly SIP through market cycles
- Patience: Let compounding work over 10-20 years
- Simplicity: 5-7 well-chosen funds beat 20 mediocre ones
- Action: Start today, even with small amounts
The Perfect Time to Invest:
- The best time was 10 years ago
- The second best time is today
- The worst time is never
As a global Indian (NRI), you have unique advantages:
- Access to multiple currencies and markets
- Potentially higher income stability
- Longer investment horizon in many cases
- Ability to diversify across geographies
Use these advantages to build substantial wealth through disciplined, systematic investing.
Remember: Wealth is built through consistent actions over long periods, not through perfect timing or complex strategies.
Start today. Start small if needed. But start.
Resources for Further Learning
Recommended Websites
- SEBI Official: www.sebi.gov.in (regulations, fund database)
- MutualFund Explorer: SEBI's official portal for fund information
- AMFI: www.amfiindia.com (Industry association data)
- Morningstar India: www.morningstars.in (Fund research)
- Value Research Online: www.valueresearchonline.com (Analysis and ratings)
Recommended Books
- "The Bogleheads' Guide to Investing" by Mel Bogle et al.
- "A Random Walk Down Wall Street" by Burton Malkiel
- "The Intelligent Investor" by Benjamin Graham
- "Market Wizards" by Jack Schwager
Key Regulatory Documents
- SEBI Mutual Fund Regulations 1996
- Fund Factsheets (from individual AMC websites)
- Draft Fund Offer Documents
- Scheme Information Documents
Document Information
Framework Version: 1.0 Last Updated: December 2025 Applicable For: Indian Mutual Funds, NRI Investors Currency: Indian Rupees (INR) Tax Laws: As per Indian Income Tax Act, 1961 (Till December 2025) Disclaimer: This framework is for educational purposes only and is not investment advice or a recommendation to buy, sell, or hold any specific scheme. NRI Wealth Partners operates as an AMFI-registered mutual fund distributor (ARN-360468) and a Chartered Accountant practice; we are not a SEBI-registered investment adviser or research analyst. Any fund categories or sample portfolios shown are illustrative examples, not recommendations. Consult a SEBI-registered investment adviser and your tax advisor before making investment decisions based on your own circumstances. Past performance does not guarantee future results. Mutual fund investments are subject to market risks; read all scheme-related documents carefully.
NRI Wealth Partners | Your Partner in Global Wealth Management Empowering Global Indians to Build Lasting Wealth
For personalized guidance on your specific situation, contact our advisors.