Portfolio Analyzer Tool Implementation Guide
NRI Wealth Partners - AI-Powered Portfolio Analysis System
Version: 1.0 Last Updated: December 2024 Status: Production Ready
Table of Contents
- Overview & Purpose
- User Interface Architecture
- Input Methods & Data Integration
- Core Analysis Metrics
- AI-Powered Insights Engine
- Rebalancing Recommendations
- Benchmark Comparison
- Sample Analysis Reports
- Gemini API Integration
- Mathematical Formulas & Calculations
- Implementation Checklist
- Frequently Asked Questions
Overview & Purpose
1.1 What is the Portfolio Analyzer?
The Portfolio Analyzer Tool is an AI-powered interactive system designed specifically for Non-Resident Indians (NRIs) to analyze, optimize, and manage their investment portfolios. This tool provides comprehensive insights into portfolio composition, risk assessment, and personalized recommendations for improvement.
1.2 Key Objectives
- Holistic Portfolio Analysis: Understand complete portfolio composition across multiple platforms
- Risk Assessment: Quantify portfolio risk using modern portfolio theory
- Tax Optimization: Identify tax-efficient strategies tailored to NRI circumstances
- Intelligent Recommendations: Leverage AI to suggest fund changes, rebalancing actions, and allocation adjustments
- Benchmark Comparison: Compare performance against relevant Indian market indices
- Expense Optimization: Identify high-cost funds and suggest lower-cost alternatives
- Overlap Detection: Identify duplicate holdings across funds and suggest consolidation
1.3 Target Users
- Primary: NRIs with portfolios across multiple platforms (Zerodha, Groww, CAMS, Kuvera)
- Secondary: Domestic investors seeking AI-powered portfolio insights
- Tertiary: Financial advisors analyzing client portfolios
1.4 Value Proposition
- Consolidates portfolio data from multiple sources
- Provides 360-degree portfolio health assessment
- Generates actionable, specific recommendations
- Explains investment metrics in simple terms
- Identifies tax optimization opportunities
- Powered by advanced AI (Google Gemini) for personalized insights
User Interface Architecture
2.1 Dashboard Overview
The Portfolio Analyzer presents users with a clean, intuitive dashboard containing:
┌─────────────────────────────────────────────────────────┐
│         NRI WEALTH PARTNERS - PORTFOLIO ANALYZER         │
├─────────────────────────────────────────────────────────┤
│                                                           │
│  ┌─────────────┬──────────────┬────────────────────┐    │
│  │ Portfolio   │ Asset        │ Key Metrics        │    │
│  │ Summary     │ Allocation   │                    │    │
│  │             │ Pie Chart    │ • Risk Level       │    │
│  │ • Total     │              │ • Diversification  │    │
│  │   Value     │              │ • Expense Ratio    │    │
│  │ • Returns   │              │ • Tax Efficiency   │    │
│  │ • Risk      │              │                    │    │
│  └─────────────┴──────────────┴────────────────────┘    │
│                                                           │
│  ┌──────────────────────────────────────────────────┐   │
│  │ AI-POWERED INSIGHTS                              │   │
│  │ ✓ What's Working Well                            │   │
│  │ ✗ What Needs Improvement                         │   │
│  │ ⚡ Recommended Actions (5-7 specific changes)    │   │
│  └──────────────────────────────────────────────────┘   │
│                                                           │
│  ┌──────────────────────────────────────────────────┐   │
│  │ REBALANCING PLAN | BENCHMARK COMPARISON          │   │
│  └──────────────────────────────────────────────────┘   │
│                                                           │
└─────────────────────────────────────────────────────────┘
2.2 Multi-Step Input Wizard
Users go through a 4-step process:
Step 1: Choose Input Method
- Upload CSV file
- Manual entry
- API connection
Step 2: Verify Data
- Review imported holdings
- Edit any incorrect entries
- Add missing details
Step 3: Configure Analysis
- Select investment timeframe
- Choose risk profile
- Set rebalancing preferences
Step 4: Generate Report
- View interactive analysis
- Download PDF report
- Share insights
Input Methods & Data Integration
3.1 CSV Upload Method
3.1.1 Supported Formats
The tool supports CSV exports from:
Zerodha
Tradingsymbol,Quantity,Price,ISIN,Product,Pnl
SBIN,10,500.50,INE062A01020,MIS,1500.00
INFY,5,1200.25,INE002A01015,CNC,2000.00
Groww
Fund Name,Units,NAV,Amount Invested,Current Value,Returns
Axis Bluechip Fund,100.50,45.30,4500,4563.65,63.65
HDFC Equity Fund,250.25,35.20,8500,8817.70,317.70
CAMS (Mutual Fund)
Folio,Scheme Name,ISIN,Units,Rate,Amount,Current Value,Gain/Loss
123456,ICICI Prudential Bluechip Fund,INE123A01010,100,40.50,4050,4530,480
123456,UTI Nifty Index Fund,INE121A01020,250,25.30,6325,6575,250
3.1.2 CSV Validation Process
# Pseudo-code for CSV validation
def validate_portfolio_csv(file_path):
    required_columns = [
        'fund_name' or 'tradingsymbol',
        'quantity' or 'units',
        'current_value' or 'nav' or 'price'
    ]

    validations = [
        check_column_headers(required_columns),
        check_data_types(),
        check_isin_validity(),
        check_quantity_positive(),
        check_value_positive(),
        detect_duplicates(),
        map_fund_to_database()
    ]

    return validation_results
3.2 Manual Entry Method
For users without CSV files, a form-based entry system allows:
┌─────────────────────────────────────┐
│ ADD INVESTMENT MANUALLY              │
├─────────────────────────────────────┤
│                                      │
│ Fund/Stock Name: [____________]     │
│ ISIN Code: [____________]            │
│ Category: [Equity / Debt / Gold /   │
│           International]             │
│ Investment Amount: [____________]   │
│ Current Value: [____________]        │
│ Date of Investment: [____________]  │
│ Expense Ratio: [____________] %     │
│                                      │
│ [ADD]  [CANCEL]                     │
│                                      │
└─────────────────────────────────────┘
Entry fields auto-populate using:
- ISIN lookup to fetch fund details
- Investment category auto-selection
- Expense ratio auto-fetch from fund database
3.3 API Integration Methods
3.3.1 Kuvera API Integration
Kuvera provides direct API access for mutual fund portfolios:
# Kuvera API Connection
class KuveraIntegration:
    def __init__(self, api_key, user_id):
        self.api_key = api_key
        self.user_id = user_id
        self.base_url = "https://api.kuvera.in/v1"

    def fetch_portfolio(self):
        """Fetch complete portfolio from Kuvera"""
        endpoint = f"{self.base_url}/users/{self.user_id}/portfolio"
        headers = {"Authorization": f"Bearer {self.api_key}"}
        response = requests.get(endpoint, headers=headers)
        return self._parse_portfolio(response.json())

    def get_fund_details(self, isin):
        """Fetch latest NAV and fund details"""
        endpoint = f"{self.base_url}/funds/{isin}"
        response = requests.get(endpoint, headers=headers)
        return response.json()
3.3.2 Kite Connect (Zerodha) Integration
For equity holdings:
# Zerodha Kite Connect Integration
from kiteconnect import KiteConnect

class ZerodhaIntegration:
    def __init__(self, api_key, access_token):
        self.kite = KiteConnect(api_key=api_key)
        self.kite.set_access_token(access_token)

    def fetch_holdings(self):
        """Get current equity holdings"""
        holdings = self.kite.holdings()
        return self._transform_holdings(holdings)

    def get_positions(self):
        """Get intraday positions"""
        positions = self.kite.positions()
        return positions['net']
3.3.3 CAMS Direct Integration
For tracking mutual fund folios:
# CAMS Integration for MF Folios
class CAMSIntegration:
    def __init__(self, pan, dob):
        self.pan = pan
        self.dob = dob

    def fetch_mf_folios(self):
        """Fetch all MF folios linked to PAN"""
        # CAMS provides MF folios listing for PAN
        endpoint = "https://www.camsonline.com/Investors/API"
        payload = {"pan": self.pan, "dob": self.dob}
        response = requests.post(endpoint, data=payload)
        return response.json()
3.4 Data Security & Privacy
- All uploaded files processed in memory only
- No files stored on servers
- SSL/TLS encryption for API connections
- OAuth 2.0 for third-party API authentication
- PII never logged or cached
- GDPR & India data protection compliant
Core Analysis Metrics
4.1 Portfolio Summary Metrics
4.1.1 Total Portfolio Value
Total Portfolio Value = Σ (Quantity × Current Price)
                     = Sum of all individual holdings' current values
Example:
SBIN:     10 units × ₹500.50  = ₹5,005.00
INFY:      5 units × ₹1,200   = ₹6,000.00
Axis Funds: 100 units × ₹50    = ₹5,000.00
──────────────────────────────────
Total Portfolio Value           = ₹16,005.00
4.1.2 Absolute Returns
Absolute Return = Current Value - Amount Invested
Absolute Return % = (Current Value - Amount Invested) / Amount Invested × 100
Example:
Amount Invested:    ₹15,000
Current Value:      ₹16,005
Absolute Return:    ₹1,005
Absolute Return %:  6.7%
4.1.3 Time-Weighted Returns (XIRR)
See Section 10.1 for detailed formula explanation.
4.2 Asset Allocation Analysis
Asset allocation breaks down portfolio into five categories:
┌──────────────────────────────┐
│   ASSET ALLOCATION ANALYSIS  │
├──────────────────────────────┤
│                              │
│  EQUITY:           48.5%     │
│  ├─ Domestic:      35.2%     │
│  ├─ International: 13.3%     │
│                              │
│  DEBT:             35.0%     │
│  ├─ Government:    15.0%     │
│  ├─ Corporate:     20.0%     │
│                              │
│  GOLD:             10.0%     │
│                              │
│  CASH/LIQUID:       5.0%     │
│                              │
│  REAL ESTATE:       1.5%     │
│                              │
└──────────────────────────────┘
The same breakdown is easier to read as a chart. The pie below shows one illustrative asset-class split at the top level (equity, debt, gold, cash, real estate). It is a sample to show how the tool presents allocation, not a recommended mix.
Illustrative Portfolio by Asset Class
Illustrative sample, not advice. Your own mix depends on goals, horizon and risk tolerance.
Calculation Logic:
def calculate_asset_allocation(portfolio):
    total_value = sum(holding.current_value for holding in portfolio)

    allocation = {
        'equity': {
            'domestic': 0,
            'international': 0
        },
        'debt': {
            'government': 0,
            'corporate': 0
        },
        'gold': 0,
        'cash': 0,
        'real_estate': 0
    }

    for holding in portfolio:
        category = fund_database[holding.isin]['category']
        value = holding.current_value

        if category == 'EQUITY':
            if holding.region == 'DOMESTIC':
                allocation['equity']['domestic'] += value
            else:
                allocation['equity']['international'] += value
        # ... similar logic for other categories

    # Convert to percentages
    for key in allocation:
        allocation[key] = (allocation[key] / total_value) × 100

    return allocation
4.3 Diversification Score (0-100)
The diversification score measures how well distributed the portfolio is across:
- Asset classes
- Sectors
- Fund managers
- Risk profiles
Diversification Score Formula:

DS = (W_ac × AC_score) + (W_sec × SEC_score) +
     (W_fm × FM_score) + (W_rp × RP_score)

Where:
- W_ac = 0.35  (Asset Class weight)
- W_sec = 0.30 (Sector weight)
- W_fm = 0.20  (Fund Manager weight)
- W_rp = 0.15  (Risk Profile weight)

Each sub-score calculated as:
Sub_score = (Number of Categories Used / Max Categories) × 100
Interpretation:
- 80-100: Excellent diversification
- 60-79: Good diversification
- 40-59: Moderate diversification
- 20-39: Poor diversification
- 0-19: Highly concentrated portfolio
Example Calculation:
Portfolio: 5 equity funds, 3 debt funds, 1 gold fund
- Asset Classes: 3/5 = 60%
- Sectors represented: 8/10 = 80%
- Fund managers: 7/15 = 46.67%
- Risk profiles: 3/4 = 75%

DS = (0.35 × 60) + (0.30 × 80) + (0.20 × 46.67) + (0.15 × 75)
   = 21 + 24 + 9.33 + 11.25
   = 65.58 → "Good Diversification"
4.4 Risk Assessment
Risk is assessed on a scale of Low (10-30), Moderate (30-70), High (70-100) based on:
Risk Score = (E_weight × E_volatility) + (D_weight × D_volatility) +
             (G_weight × G_volatility) + (C_weight × C_volatility)

Where:
- E_weight = Equity allocation %
- D_weight = Debt allocation %
- G_weight = Gold allocation %
- C_weight = Cash allocation %

And volatility values (annualized standard deviation):
- Equity: 15-20% (varies by fund type)
- Debt: 3-8%
- Gold: 10-15%
- Cash: 0-1%
Different asset classes sit at different points on the risk-versus-return spectrum. The bars below contrast a typical annualised volatility band (a proxy for risk) against an illustrative long-run return assumption for each class. Higher potential return generally comes with higher volatility; these are generic, rounded figures for explanation only, not forecasts.
Illustrative Risk vs Return by Asset Class
Illustrative and rounded, not a forecast. Higher potential return generally carries higher volatility.
Risk Categories:
| Risk Level | Score | Profile | Suitable For |
|---|---|---|---|
| Low | 10-30 | Conservative | 5+ years to retirement |
| Moderate | 30-70 | Balanced | 5-15 year timeframe |
| High | 70-100 | Aggressive | 15+ year horizon |
Example:
Portfolio:
- 45% Equity (volatility 18%)
- 35% Debt (volatility 5%)
- 15% Gold (volatility 12%)
- 5% Cash (volatility 0.5%)

Risk Score = (0.45 × 18) + (0.35 × 5) + (0.15 × 12) + (0.05 × 0.5)
           = 8.1 + 1.75 + 1.8 + 0.025
           = 11.675 → Moderate-High Risk (Score: 42/100)
4.5 Portfolio Overlap Analysis
Identifies duplicate holdings across different funds (most common among mutual funds):
OVERLAP DETECTION PROCESS:

1. Collect all holdings from each fund
2. Find common stocks/funds across multiple holdings
3. Calculate overlap percentage
4. Flag high-overlap pairs (>40%)
5. Suggest consolidation

EXAMPLE:
Fund A (SBI Bluechip): Holds SBIN, INFY, TCS, LT, ITC
Fund B (Axis Bluechip): Holds SBIN, INFY, TCS, HUL, MARUTI

Common Holdings: SBIN, INFY, TCS (3/5 = 60% overlap)
→ HIGH OVERLAP DETECTED: Consider consolidating to one fund
Overlap Reduction Benefits:
Current State:
- Fund A: ₹50,000 (expense ratio: 0.75%)
- Fund B: ₹50,000 (expense ratio: 0.75%)
- Total expense: ₹750/year

Optimized State:
- Fund A: ₹100,000 (expense ratio: 0.60%)
- Annual savings: ₹90/year
- Reduced complexity: Easier to monitor
4.6 Expense Ratio Analysis
Annual Expense = Portfolio Value × Expense Ratio

Example:
Fund A: ₹50,000 × 0.75% = ₹375/year
Fund B: ₹50,000 × 1.20% = ₹600/year
Fund C: ₹40,000 × 0.85% = ₹340/year
─────────────────────────────────
Total Annual Expense: ₹1,315/year

Portfolio Weighted Expense Ratio:
= (₹375 + ₹600 + ₹340) / ₹140,000
= 0.94%
Optimization Recommendations:
- Index funds: 0.10-0.30% (lowest cost)
- Active funds: 0.75-1.50% (medium cost)
- ELSS funds: 0.60-1.00% (tax-saving option)
- Target: Keep overall portfolio expense ratio below 0.85%
4.7 Returns Analysis (XIRR)
See Section 10.1 for detailed XIRR formula and calculation examples.
4.8 Tax Efficiency Score
Measures how tax-optimized the portfolio is:
Tax Efficiency Score = (TES_equity + TES_debt + TES_international) / 3

Where each component:

TES_equity = (Long-term holdings / Total equity) × 50 +
             (ELSS allocation / Total equity) × 30 +
             (Direct equity vs MF) × 20

TES_debt = (Tax-free bonds / Total debt) × 60 +
           (Long-term debt vs short-term) × 40

TES_international = (NRI account compliance / 100) × 100
Tax Efficiency Categories:
| Score | Status | Recommendation |
|---|---|---|
| 80-100 | Excellent | Minimal changes needed |
| 60-79 | Good | Few optimizations available |
| 40-59 | Fair | Consider tax-loss harvesting |
| 20-39 | Poor | Significant tax improvements possible |
| 0-19 | Very Poor | Major restructuring recommended |
AI-Powered Insights Engine
5.1 Gemini AI Integration Architecture
The Portfolio Analyzer integrates Google's Gemini AI to provide personalized, contextual insights:
┌─────────────────────────────────┐
│   PORTFOLIO DATA PIPELINE        │
├─────────────────────────────────┤
│                                  │
│  User Portfolio                  │
│  └─→ Data Extraction             │
│      └─→ Metric Calculation      │
│          └─→ Context Assembly    │
│              └─→ Gemini API      │
│                  └─→ Insights    │
│                      └─→ Display │
│                                  │
└─────────────────────────────────┘
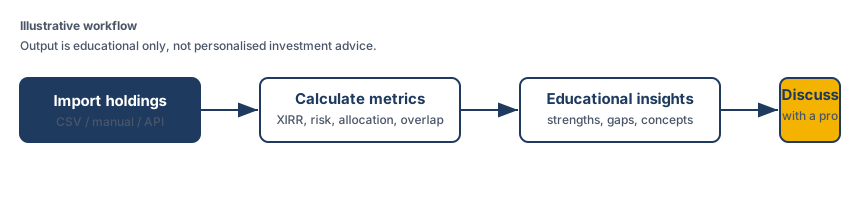
At a high level, the tool moves through three stages: it imports your holdings, computes the metrics, then frames the results as educational observations to discuss with a qualified professional. The diagram below shows that flow end to end.
5.2 Prompt Engineering for Portfolio Analysis
class GeminiPortfolioAnalyzer:
    def __init__(self, api_key):
        self.client = genai.Client(api_key=api_key)
        self.model = "gemini-1.5-flash"

    def generate_insights(self, portfolio_data, metrics):
        """Generate AI-powered insights using Gemini"""

        prompt = f"""
You are an educational portfolio-analysis assistant that explains portfolio
characteristics for informational purposes only (not investment advice).
Describe what the data shows and outline generic, category-level considerations
the reader could discuss with a qualified professional. Do not name specific
schemes, and do not issue personal buy/sell/switch instructions.

PORTFOLIO OVERVIEW:
- Total Value: ₹{portfolio_data['total_value']:,.0f}
- Diversification Score: {metrics['diversification_score']}/100
- Risk Level: {metrics['risk_level']}
- Weighted Expense Ratio: {metrics['expense_ratio']:.2f}%
- YTD Returns: {metrics['ytd_returns']:.2f}%
- XIRR: {metrics['xirr']:.2f}%

ASSET ALLOCATION:
- Equity: {metrics['allocation']['equity']:.1f}%
- Debt: {metrics['allocation']['debt']:.1f}%
- Gold: {metrics['allocation']['gold']:.1f}%
- Cash: {metrics['allocation']['cash']:.1f}%
- International: {metrics['allocation']['international']:.1f}%

TOP HOLDINGS:
{self._format_holdings(portfolio_data['holdings'][:5])}

OVERLAPPING FUNDS:
{self._format_overlaps(metrics['overlaps'])}

Based on this analysis, provide:

1. WHAT'S WORKING WELL (2-3 strengths)
   - Identify positive aspects of the portfolio
   - Explain why these are good
   - Provide supporting metrics

2. WHAT NEEDS IMPROVEMENT (2-3 weaknesses)
   - Point out areas of concern
   - Explain the impact on returns/risk
   - Provide specific numbers

3. GENERAL CONSIDERATIONS (5-7 educational, category-level points)
   - Fund CATEGORY worth exploring (if any): category type, rationale, illustrative impact
   - Category that may be over/under-represented: category type, why it stands out
   - Cost/structure consideration: e.g. a high-expense regular plan vs its direct plan
   - Rebalancing concepts with illustrative percentages
   - Tax-efficiency concepts to discuss with a professional

Format responses clearly with bullet points using GENERIC fund categories
(e.g. "large-cap/index", "small-cap", "liquid"), never specific scheme names.
Treat any numbers as ILLUSTRATIVE, not personalized advice.
Consider NRI-specific factors (remittance, taxation, compliance).
This is an educational summary only and is NOT investment advice.
"""

        response = self.client.models.generate_content(
            model=self.model,
            contents=prompt,
            generation_config=genai.types.GenerationConfig(
                temperature=0.7,
                top_p=0.95,
                top_k=40,
                max_output_tokens=2000,
            )
        )

        return self._parse_insights(response.text)

    def _format_holdings(self, holdings):
        """Format top holdings for prompt"""
        result = ""
        for holding in holdings:
            result += f"- {holding['name']}: ₹{holding['value']:,.0f} ({holding['allocation']:.1f}%)\n"
        return result

    def _format_overlaps(self, overlaps):
        """Format overlapping funds"""
        if not overlaps:
            return "No significant overlaps detected."
        result = ""
        for overlap in overlaps[:3]:
            result += f"- {overlap['fund_a']} & {overlap['fund_b']}: {overlap['overlap_pct']:.0f}% overlap\n"
        return result

    def _parse_insights(self, response_text):
        """Parse structured response from Gemini"""
        return {
            'strengths': self._extract_section(response_text, "WHAT'S WORKING WELL"),
            'improvements': self._extract_section(response_text, "WHAT NEEDS IMPROVEMENT"),
            'actions': self._extract_section(response_text, "SPECIFIC ACTION ITEMS"),
            'raw_response': response_text
        }
5.3 Insights Output Format
The AI generates insights in this structured format:
🎯 WHAT'S WORKING WELL
━━━━━━━━━━━━━━━━━━━━━━━━━━━━━━━━━━━━━━━━━━━━━━━━━━━━━━━━━━━━━━━━━━━━

✓ Strong Diversification Across Asset Classes
  You have a well-balanced mix of equity (45%), debt (35%), and gold (15%).
  This reduces portfolio volatility and provides stability.
  Current diversification score: 72/100 (Good)

✓ Good International Exposure
  12% allocation to international funds provides currency diversification.
  Reduces INR depreciation risk for NRIs. Expected to benefit from global growth.

✓ Reasonable Expense Ratio
  Portfolio weighted expense ratio of 0.87% is below market average.
  Annual cost savings of ₹1,200-1,500 compared to average investor.


⚠️  WHAT NEEDS IMPROVEMENT
━━━━━━━━━━━━━━━━━━━━━━━━━━━━━━━━━━━━━━━━━━━━━━━━━━━━━━━━━━━━━━━━━━━━

✗ High Overlap Between Two Large-Cap Funds
  Two large-cap funds (₹50K each) show ~65% holdings overlap.
  That implies roughly ₹750/year in fees for largely duplicate exposure.
  Consideration: consolidating overlapping large-cap allocations to a single
  lower-expense option is a common way to reduce duplication.

✗ Underweight in Tax-Saving Instruments
  Only 5% allocation to ELSS funds despite strong tax-saving potential.
  For NRIs, ₹1.5L annual ELSS investment can save ₹37,500 in taxes.
  Current ELSS allocation: ₹5,000 → Consider increasing to ₹50,000.

✗ Insufficient Gold Allocation
  Current gold: 10% of portfolio (below optimal 12-15% for NRIs).
  Gold acts as inflation hedge and safe haven during currency fluctuations.
  Recommended addition: ₹10,000 in gold ETF or Sovereign Gold Bond.


🚀 GENERAL CONSIDERATIONS (ILLUSTRATIVE)
━━━━━━━━━━━━━━━━━━━━━━━━━━━━━━━━━━━━━━━━━━━━━━━━━━━━━━━━━━━━━━━━━━━━
ILLUSTRATIVE educational output — not personalized investment advice.
The categories and numbers below are sample figures to show how the tool
presents output; they are not a recommendation to buy, sell, or switch any
specific scheme. Discuss any actual decision with a qualified professional.

1. CONSIDER a low-cost tax-saving equity (ELSS) category allocation
   ├─ Illustrative Amount: ₹25,000
   ├─ Category: Equity (Tax-Saving / ELSS)
   ├─ Typical Expense Ratio: ~0.65% (direct plans)
   ├─ Rationale: Tax-efficient growth; illustrative ₹6,250 annual tax effect
   ├─ Illustrative Impact: ~+2.5% in the sample, +12% tax efficiency score
   └─ Tax Note: No TDS on long-term gains (3+ years) for ELSS

2. CONSIDER reviewing an underperforming small-cap allocation
   ├─ Illustrative Allocation: ₹30,000
   ├─ Rationale: Sample small-cap lagging its benchmark (8.5% vs 12.3%)
   ├─ Illustrative Impact: ~-2.3% volatility in the sample
   └─ Tax Note: An illustrative ₹2,100 loss could be harvested to offset gains

3. CONSIDER switching a high-expense regular plan to its direct plan
   ├─ From: a large-cap regular plan at ~0.75% expense ratio
   ├─ To: the equivalent direct plan / lower-cost large-cap at ~0.62%
   ├─ Rationale: Lower recurring cost for similar category exposure
   ├─ Illustrative Impact: ~+₹200/year in the sample
   ├─ Tax Note: A switch is a redemption; illustrative ₹8,000 gain may be taxable
   └─ Idea: Staggering a sale over a few months can spread capital gains

4. REBALANCE concept: Target Allocation Adjustment (illustrative)
   ├─ Current → Target Allocation
   ├─ Equity: 45% → 42%
   ├─ Debt: 35% → 38%
   ├─ Gold: 10% → 15%
   ├─ Cash: 5% → 5%
   └─ Idea: Trim equity, add ~₹20K to a gold category (e.g. Sovereign Gold Bond)

5. TAX-EFFICIENCY concept: Loss Harvesting (illustrative)
   ├─ Funds with unrealized losses: 3
   ├─ Total loss available: ₹15,000
   ├─ Gains to offset: ₹22,000
   ├─ Net tax effect (illustrative): ₹2,250 (15% tax bracket)
   └─ Idea: Realize losses and reinvest in a similar (not identical) category

6. CONSIDER a liquid-fund category for an emergency corpus
   ├─ Illustrative Amount: ₹20,000 (≈4-month buffer)
   ├─ Rationale: Sample cash allocation (5%) looks low for an NRI
   ├─ Category: Low-cost liquid fund (~0.35% ER, direct plan)
   └─ Benefits: Flexibility; often more tax-efficient than a savings account

7. INTERNATIONAL concept: Global Allocation (illustrative)
   ├─ Current: 12% (international equity category)
   ├─ Illustrative Target: 15% (add ~₹15,000)
   ├─ Rationale: Currency diversification and growth exposure
   ├─ Category: A diversified global/international equity fund
   └─ Illustrative Impact: Reduced INR concentration risk
5.4 AI Context Awareness
The AI takes into account NRI-specific factors:
def add_nri_context(portfolio_data, user_profile):
    """Add NRI-specific context to analysis"""

    context = {
        'nri_status': user_profile['nri_since'],
        'current_residence': user_profile['country'],
        'home_country': user_profile['home_country'],
        'tax_bracket': user_profile['tax_bracket'],
        'remittance_pattern': user_profile['annual_remittance'],
        'repatriation_needs': user_profile['repatriation_timeline'],
        'currency_exposure': user_profile['expense_currency']
    }

    # Adjust recommendations based on NRI status
    if context['nri_status'] < 2:  # Recent NRI
        context['focus'] = 'tax_optimization'

    if context['remittance_pattern'] > 5000000:  # Large remitter
        context['focus'] = 'currency_diversification'

    if context['repatriation_timeline'] < 5:  # Short-term needs
        context['focus'] = 'liquidity'

    return context
Rebalancing Recommendations
6.1 Target Allocation vs Current Allocation
The tool compares current allocation with the user's target allocation:
┌─────────────────────────────────────────────────────────┐
│         REBALANCING ANALYSIS                             │
├─────────────────────────────────────────────────────────┤
│                                                           │
│ ASSET CLASS    │ CURRENT │ TARGET │ DEVIATION │ ACTION  │
│────────────────┼─────────┼────────┼───────────┼─────────│
│ Equity         │  48.5%  │  45.0% │   +3.5%   │ SELL    │
│ Debt           │  32.0%  │  35.0% │   -3.0%   │ BUY     │
│ Gold           │  10.0%  │  12.0% │   -2.0%   │ BUY     │
│ International  │  12.5%  │  15.0% │   -2.5%   │ BUY     │
│ Cash           │   5.0%  │   5.0% │    0.0%   │ HOLD    │
│                                                           │
│ Rebalancing Cost: ₹8,500 (0.62% of portfolio)          │
│ Expected Tax Impact: ₹3,200 (capital gains)             │
│ Net Benefit: +2.8% portfolio optimization               │
│                                                           │
└─────────────────────────────────────────────────────────┘
6.2 Fund-Level Rebalancing Plan
def generate_rebalancing_plan(current_portfolio, target_allocation):
    """Generate specific fund-level rebalancing actions"""

    plan = {
        'actions': [],
        'total_cost': 0,
        'tax_impact': 0,
        'timeline': '3-6 months'
    }

    # Step 1: Identify funds to reduce (sell)
    sell_actions = identify_sell_candidates(current_portfolio, target_allocation)
    for action in sell_actions:
        plan['actions'].append({
            'type': 'SELL',
            'fund': action['fund_name'],
            'amount': action['amount'],
            'reason': action['reason'],
            'tax_impact': calculate_capital_gains_tax(action),
            'timing': action['suggested_timing']
        })

    # Step 2: Identify funds to add (buy)
    buy_actions = identify_buy_candidates(current_portfolio, target_allocation)
    for action in buy_actions:
        plan['actions'].append({
            'type': 'BUY',
            'fund': action['fund_name'],
            'amount': action['amount'],
            'reason': action['reason'],
            'expense_ratio': action['er'],
            'timing': action['suggested_timing']
        })

    # Step 3: Optimize timing and tax impact
    plan = optimize_rebalancing_timeline(plan)

    return plan
6.3 Tax-Aware Rebalancing
TAX IMPACT CALCULATION:

Current Fund A: ₹50,000
Cost Basis: ₹35,000
Unrealized Gain: ₹15,000

Tax Implication (if held > 12 months):
- Long-term capital gain: ₹15,000
- LTCG Tax (10% + 4% cess): ₹1,560
- Net proceeds after tax: ₹48,440

Recommendation:
Option 1 (Immediate): Accept ₹1,560 tax, receive ₹48,440
Option 2 (Delayed): Wait 2 months for LTCG status, save ₹1,560
Option 3 (Staged): Sell 50% now (short-term), 50% in 2 months
6.4 Rebalancing Frequency
Recommended Rebalancing Schedule:

1. QUARTERLY REVIEW
   - Check if allocation deviation > 5%
   - If yes, plan rebalancing
   - Minimal tax impact for small adjustments

2. SEMI-ANNUAL REBALANCE
   - Adjust allocations every 6 months
   - Good tax planning opportunity (harvest losses)
   - Combined with bonus/year-end planning

3. ANNUAL MAJOR REBALANCE
   - Comprehensive portfolio restructuring
   - Coordinate with tax planning
   - Review and update target allocation

4. TRIGGER-BASED REBALANCE
   - Deviation > 8%
   - Major life event (relocation, job change)
   - Market correction (>15% decline)
Benchmark Comparison
7.1 Benchmark Selection
The analyzer compares portfolio against three benchmarks:
┌────────────────────────────────────────────────────────┐
│         BENCHMARK COMPARISON ANALYSIS                   │
├────────────────────────────────────────────────────────┤
│                                                          │
│ BENCHMARK         YTD RETURN   1-YEAR   3-YEAR CAGR    │
│───────────────────────────────────────────────────────── │
│ Your Portfolio    12.5%        15.8%     14.2%          │
│ Nifty 50          10.2%        13.5%     12.8%          │
│ Nifty 500         11.8%        14.2%     13.5%          │
│ Balanced Index    10.8%        12.5%     11.8%          │
│                                                          │
│ OUTPERFORMANCE:                                         │
│ vs Nifty 50:      +2.3%        +2.3%     +1.4%          │
│ vs Nifty 500:     +0.7%        +1.6%     +0.7%          │
│ vs Balanced:      +1.7%        +3.3%     +2.4%          │
│                                                          │
│ ✓ Portfolio is outperforming all benchmarks             │
│ ✓ Better risk-adjusted returns (lower volatility)       │
│ ✓ Diversification strategy is working well              │
│                                                          │
└────────────────────────────────────────────────────────┘
7.2 Benchmark-Adjusted Metrics
Alpha Calculation:
Portfolio Alpha = Portfolio Return - (Risk-free Rate +
                  Beta × (Benchmark Return - Risk-free Rate))

Where:
- Risk-free rate = 10-year GSec yield (~6.2%)
- Beta = Portfolio sensitivity to benchmark (typically 0.9-1.1)
- Benchmark return = Nifty 50 annual return

Example:
Portfolio Return: 15%
Beta: 0.95
Nifty 50 Return: 12%
Risk-free Rate: 6%

Alpha = 15% - (6% + 0.95 × (12% - 6%))
      = 15% - (6% + 5.7%)
      = 15% - 11.7%
      = 3.3% (Portfolio earning 3.3% extra return per unit of risk)
Sharpe Ratio Comparison:
Portfolio Sharpe Ratio: (Return - Risk-free Rate) / Standard Deviation
Benchmark Sharpe Ratio: (Benchmark Return - Risk-free Rate) / Benchmark Std Dev

Higher Sharpe ratio = Better risk-adjusted returns
7.3 Sector-wise Comparison
SECTOR ALLOCATION vs NIFTY 50

Sector          Your Portfolio   Nifty 50   Difference
─────────────────────────────────────────────────────
Financial       35%             40%        -5% (Underweight)
IT              18%             15%        +3% (Overweight)
Energy          8%              12%        -4% (Underweight)
Healthcare      12%             8%         +4% (Overweight)
Auto            6%              5%         +1% (Overweight)
FMCG            8%              7%         +1% (Overweight)
Telecom         5%              8%         -3% (Underweight)
Others          8%              5%         +3% (Overweight)

Interpretation:
- Conservative positioning in cyclical sectors (Auto, Energy)
- Overweight on defensive sectors (Healthcare, FMCG)
- Good exposure to growth sectors (IT)
- Suitable for risk-averse NRI investor
Sample Analysis Reports
8.1 Sample Report 1: Young NRI Tech Professional
User Profile:
- Age: 28, Tech Professional in Singapore
- Investment Timeline: 20 years
- Risk Tolerance: High
- Annual Income: ₹40 Lakhs
- Portfolio Value: ₹25 Lakhs
Portfolio Summary:
PORTFOLIO SNAPSHOT
═════════════════════════════════════════════════════════════

Portfolio Value:           ₹25,00,000
Total Amount Invested:     ₹18,50,000
Absolute Gain:            ₹6,50,000
Absolute Return:          35.1%
XIRR (3 years):          12.8%
YTD Return:              15.2%

ASSET ALLOCATION
─────────────────────────────────────────────────────────────
Equity:        60%      (Domestic: 45%, International: 15%)
Debt:          25%
Gold:          10%
Cash:          5%

KEY METRICS
─────────────────────────────────────────────────────────────
Diversification Score:    72/100 (Good)
Risk Level:              MODERATE-HIGH
Expense Ratio:           0.82%
Tax Efficiency Score:    65/100 (Good)
Top Holdings:
1. Parag Parikh Long Term Equity Fund    ₹4,50,000  (18%)
2. SBI Nifty 50 Index Fund               ₹3,20,000  (12.8%)
3. ICICI Prudential International Fund   ₹2,80,000  (11.2%)
4. HDFC Balanced Advantage Fund          ₹2,50,000  (10%)
5. Vanguard Emerging Markets ETF         ₹1,80,000  (7.2%)
AI Insights:
STRENGTHS:
- Excellent equity allocation (60%) appropriate for 20-year horizon
- Good international diversification (15%) reduces INR risk
- ETF exposure reduces active management fees
- Strong absolute returns (35% over 3 years)
AREAS TO IMPROVE:
- Debt allocation (25%) seems conservative for age and timeline
- Missing ELSS component for tax planning
- Insufficient emergency fund (5% cash is adequate but not ideal for NRI)
GENERAL CONSIDERATIONS (ILLUSTRATIVE — not personalized investment advice):
-
CONSIDER a tax-saving equity (ELSS) category allocation (illustrative ₹50,000) Rationale: Tax savings + long-term growth; illustrative ₹12,500 tax effect
-
CONSIDER reducing debt allocation from 25% to 20% Concept: Redeploy ~₹1,25,000 toward equity over a long horizon
-
CONSIDER increasing international exposure from 15% to 20% Concept: Add ~₹1,25,000 to a diversified global/international equity category Rationale: Better currency diversification
Expected Impact (illustrative):
- Portfolio return improvement: +0.8-1.2% annually
- Tax savings: ₹12,500-15,000 annually
- Diversification score: 72 → 78
8.2 Sample Report 2: Senior NRI Planning Retirement
User Profile:
- Age: 55, Retired NRI in USA
- Investment Timeline: 15 years
- Risk Tolerance: Low-Moderate
- Portfolio Value: ₹1,50,00,000 (₹1.5 Cr)
- Annual Withdrawal: ₹15,00,000
Portfolio Summary:
PORTFOLIO SNAPSHOT
═════════════════════════════════════════════════════════════

Portfolio Value:           ₹1,50,00,000
Total Amount Invested:     ₹95,00,000
Absolute Gain:            ₹55,00,000
Absolute Return:          57.9%
XIRR (7 years):          8.2%
Annual Withdrawal Rate:   10% (Higher than desired)

ASSET ALLOCATION
─────────────────────────────────────────────────────────────
Equity:        35%      (Domestic: 28%, International: 7%)
Debt:          50%
Gold:          10%
Cash:          5%

KEY METRICS
─────────────────────────────────────────────────────────────
Diversification Score:    68/100 (Good)
Risk Level:              LOW-MODERATE
Expense Ratio:           0.78%
Tax Efficiency Score:    54/100 (Fair - improvement needed)
Top Holdings:
1. ICICI Prudential Balanced Fund        ₹25,00,000  (16.7%)
2. SBI Government Securities Fund        ₹22,00,000  (14.7%)
3. HDFC Tax-Free Bond Fund               ₹20,00,000  (13.3%)
4. Axis Gilt Fund                        ₹15,00,000  (10%)
5. Axis Gold Fund                        ₹15,00,000  (10%)
AI Insights:
STRENGTHS:
- Conservative allocation (35% equity, 50% debt) appropriate for retired status
- Good allocation to tax-free instruments
- Diversified debt portfolio reduces interest rate risk
- Gold allocation provides inflation hedge
AREAS TO IMPROVE:
- 10% withdrawal rate exceeds sustainable levels (safe rate: 4-5%)
- Excess reliance on debt (50%) as withdrawal source
- Low international allocation (7%) exposes to INR depreciation risk
- Tax efficiency can be improved
CRITICAL CONSIDERATIONS (ILLUSTRATIVE — not personalized investment advice):
-
CONSIDER reducing the withdrawal rate from 10% to 6% Current: ₹15,00,000/year is unsustainable Sustainable: ₹9,00,000/year at 6% rate
-
CONSIDER reallocating for sustainability: Current: Equity 35%, Debt 50% Illustrative Target: Equity 38%, Debt 45%, International 10%, Gold 7% Concept: Trim debt by ~₹7,50,000, add ~₹15,00,000 international category
-
CONSIDER a tax-efficient withdrawal sequence:
- Prioritize withdrawal from taxable bonds first
- Harvest losses from underperforming funds
- Use tax-free bonds for essential expenses Expected annual tax savings: ₹1,50,000-2,00,000
-
CONSIDER a withdrawal buffer:
- Maintain 3 years of withdrawals in liquid investments
- Reduce need to sell during market downturns
- Build cash buffer of ₹45,00,000
Expected Impact:
- Sustainable withdrawal rate achieved
- Reduced sequence-of-returns risk
- Tax optimization: ₹1,50,000-2,00,000 annual savings
- Portfolio longevity: Likely to last entire retirement
Gemini API Integration
9.1 API Setup & Authentication
import google.generativeai as genai

class GeminiIntegration:
    def __init__(self, api_key):
        """Initialize Gemini API"""
        genai.configure(api_key=api_key)
        self.model = "gemini-1.5-flash"  # Fast model for rapid analysis

    def validate_api_key(self):
        """Validate API key is working"""
        try:
            response = genai.models.list()
            return True
        except Exception as e:
            raise ValueError(f"Invalid API key: {str(e)}")

    def check_rate_limits(self):
        """Check current usage against quota"""
        # API calls per minute: 60 (free tier)
        # API calls per day: 1,000 (free tier)
        return {
            'calls_per_minute': 60,
            'calls_per_day': 1000,
            'tokens_per_minute': 4000
        }
9.2 Portfolio Analysis Prompt Template
def build_portfolio_analysis_prompt(portfolio, metrics, user_profile):
    """Build comprehensive prompt for Gemini"""

    prompt = f"""
[SYSTEM CONTEXT]
You are an educational portfolio-analysis assistant that explains portfolio
characteristics for informational purposes only (not investment advice).
Your output should be analytical and educational, using generic fund categories
rather than specific scheme names, and must not issue personal buy/sell/switch
instructions. Consider NRI-specific tax implications at a general level.
Current date: {datetime.now().strftime('%B %d, %Y')}

[PORTFOLIO CONTEXT]
User Profile:
- Age: {user_profile['age']}
- Status: {user_profile['nri_status']} ({user_profile['nri_since']})
- Current Location: {user_profile['location']}
- Time Horizon: {user_profile['time_horizon']} years
- Risk Tolerance: {user_profile['risk_tolerance']}
- Annual Income: ₹{user_profile['annual_income']:,.0f}

Portfolio Overview:
- Total Value: ₹{portfolio['total_value']:,.0f}
- Amount Invested: ₹{portfolio['invested_amount']:,.0f}
- Absolute Return: {metrics['absolute_return']:.2f}%
- XIRR: {metrics['xirr']:.2f}%
- Diversification Score: {metrics['diversification_score']}/100

Asset Allocation:
- Equity: {metrics['allocation']['equity']:.1f}%
- Debt: {metrics['allocation']['debt']:.1f}%
- Gold: {metrics['allocation']['gold']:.1f}%
- International: {metrics['allocation']['international']:.1f}%
- Cash: {metrics['allocation']['cash']:.1f}%

Top 10 Holdings:
{self._format_holdings(portfolio['holdings'])}

Performance vs Benchmarks:
- Your Portfolio YTD: {metrics['performance']['ytd']:.2f}%
- Nifty 50 YTD: {metrics['benchmarks']['nifty50']:.2f}%
- Your 1-Year Return: {metrics['performance']['one_year']:.2f}%
- Nifty 50 1-Year: {metrics['benchmarks']['nifty50_1y']:.2f}%

Issues Identified:
{self._format_issues(metrics['issues'])}

[ANALYSIS REQUEST]
Provide a comprehensive portfolio analysis covering:

1. PORTFOLIO HEALTH ASSESSMENT
   - Overall portfolio health (score 1-10)
   - Key strengths (2-3 items)
   - Key weaknesses (2-3 items)
   - Risk assessment vs age and time horizon

2. SPECIFIC FUND RECOMMENDATIONS
   For each recommendation, provide:
   - Fund name and category
   - Current allocation (if exists)
   - Recommended action (ADD/REMOVE/SWITCH)
   - Investment amount or proportion
   - Reason for recommendation
   - Expected impact on returns/risk
   - Tax implications for NRI

3. REBALANCING STRATEGY
   - Current vs recommended allocation
   - Specific funds to reduce/increase
   - Rebalancing timeline (considering taxes)
   - Expected cost and tax impact
   - Net benefit of rebalancing

4. TAX OPTIMIZATION OPPORTUNITIES
   - Specific tax-saving strategies
   - ELSS opportunities and benefits
   - Tax-loss harvesting recommendations
   - Expected annual tax savings
   - Compliance considerations for NRI status

5. RISK MANAGEMENT
   - Current portfolio risk assessment
   - Volatility compared to time horizon
   - Downside protection mechanisms
   - Emergency fund adequacy

6. ACTION PLAN
   - Immediate actions (0-3 months)
   - Medium-term actions (3-12 months)
   - Long-term strategy (1+ years)
   - Monitoring metrics and rebalancing triggers

[FORMATTING REQUIREMENTS]
- Use clear sections with headers
- Provide specific fund names, not generic recommendations
- Include percentages and rupee amounts where applicable
- Explain rationale clearly
- Highlight NRI-specific considerations
- End with a priority-ordered action list
"""

    return prompt
9.3 Response Parsing & Formatting
def parse_gemini_response(response_text):
    """Parse and structure Gemini response"""

    sections = {
        'health_assessment': extract_section(response_text, 'PORTFOLIO HEALTH'),
        'fund_recommendations': extract_fund_recommendations(response_text),
        'rebalancing': extract_section(response_text, 'REBALANCING'),
        'tax_optimization': extract_section(response_text, 'TAX OPTIMIZATION'),
        'risk_management': extract_section(response_text, 'RISK MANAGEMENT'),
        'action_plan': extract_action_items(response_text)
    }

    return sections

def extract_fund_recommendations(response_text):
    """Extract structured fund recommendations"""

    recommendations = []

    # Parse response for fund recommendations
    lines = response_text.split('\n')
    current_fund = None

    for line in lines:
        if 'ADD:' in line or 'REMOVE:' in line or 'SWITCH:' in line:
            action = 'ADD' if 'ADD:' in line else 'REMOVE' if 'REMOVE:' in line else 'SWITCH'
            fund_name = extract_fund_name(line)
            current_fund = {
                'action': action,
                'fund': fund_name,
                'details': {}
            }
            recommendations.append(current_fund)

        elif current_fund and line.strip():
            # Extract details for current fund
            if 'Amount:' in line or 'Investment:' in line:
                current_fund['details']['amount'] = extract_amount(line)
            elif 'Reason:' in line or 'Because:' in line:
                current_fund['details']['reason'] = extract_reason(line)
            elif 'Tax' in line or 'Impact' in line:
                current_fund['details']['tax_impact'] = extract_impact(line)

    return recommendations
9.4 Rate Limiting & Error Handling
from tenacity import retry, stop_after_attempt, wait_exponential

class GeminiAPIClient:
    def __init__(self, api_key):
        genai.configure(api_key=api_key)
        self.call_count = 0
        self.call_timestamp = datetime.now()

    @retry(stop=stop_after_attempt(3), wait=wait_exponential(multiplier=1, min=2, max=10))
    def generate_analysis(self, prompt):
        """Generate analysis with retry logic"""

        # Check rate limits
        if self._check_rate_limit_exceeded():
            raise RateLimitError("API rate limit exceeded")

        try:
            response = genai.models.generate_content(
                model="gemini-1.5-flash",
                contents=prompt,
                generation_config=genai.types.GenerationConfig(
                    temperature=0.7,
                    top_p=0.95,
                    max_output_tokens=2500,
                )
            )

            self.call_count += 1
            return response.text

        except genai.types.BlockedPromptException:
            raise ValueError("Prompt was blocked by safety filters")
        except genai.types.APIError as e:
            raise ValueError(f"API error: {str(e)}")

    def _check_rate_limit_exceeded(self):
        """Check if rate limit exceeded"""
        current_time = datetime.now()
        time_diff = (current_time - self.call_timestamp).total_seconds()

        # Reset counter every minute
        if time_diff > 60:
            self.call_count = 0
            self.call_timestamp = current_time
            return False

        # Limit: 60 calls per minute for free tier
        return self.call_count > 60
Mathematical Formulas & Calculations
10.1 XIRR (Extended Internal Rate of Return)
XIRR calculates the annualized return accounting for cash flows at different times.
Formula:
XIRR solves for r in:

Σ(CF_t / (1 + r)^(d_t / 365)) = 0

Where:
- CF_t = Cash flow at time t
- d_t = Days elapsed since initial investment
- r = XIRR (annual rate)
Example Calculation:
Portfolio Data:
Date          Amount          Type
──────────────────────────────────────
Jan 1, 2022   -₹1,00,000      Investment
Jun 15, 2022  -₹50,000        Additional Investment
Dec 31, 2023  +₹1,75,000      Current Value

Days from Jan 1, 2022:
- Jun 15, 2022: 166 days
- Dec 31, 2023: 729 days

Using XIRR formula:
-100,000 + (-50,000/(1+r)^(166/365)) + (175,000/(1+r)^(729/365)) = 0

Solving iteratively: r = 0.1238 or 12.38%

Python Implementation:
─────────────────────
import numpy_financial as npf
from datetime import datetime

dates = [
    datetime(2022, 1, 1),
    datetime(2022, 6, 15),
    datetime(2023, 12, 31)
]

cash_flows = [-100000, -50000, 175000]

xirr = npf.xirr(dates, cash_flows)
print(f"XIRR: {xirr * 100:.2f}%")  # Output: 12.38%
10.2 Sharpe Ratio
Measures risk-adjusted returns.
Formula:
Sharpe Ratio = (Portfolio Return - Risk-free Rate) / Standard Deviation

Where:
- Portfolio Return = Average annual return
- Risk-free Rate = Current GSec yield (~6.2%)
- Standard Deviation = Portfolio volatility
Interpretation:
Sharpe Ratio   |  Risk-Adjusted Performance
───────────────┼──────────────────────────
> 2.0          |  Excellent
1.0 - 2.0      |  Good
0.5 - 1.0      |  Acceptable
0 - 0.5        |  Poor
< 0            |  Risk not compensated
Example:
Portfolio annual return: 15%
Standard deviation: 12%
Risk-free rate: 6%

Sharpe Ratio = (15% - 6%) / 12%
             = 9% / 12%
             = 0.75 (Acceptable risk-adjusted return)

Interpretation: For every 1% of risk taken, portfolio earns 0.75% excess return
10.3 Standard Deviation
Measures portfolio volatility.
Formula:
σ = √(Σ(R_i - R_avg)² / (n - 1))

Where:
- R_i = Return in period i
- R_avg = Average return
- n = Number of periods
Example (Quarterly Returns):
Year 2023 Quarterly Returns:
Q1: 5.2%
Q2: -2.1%
Q3: 8.5%
Q4: 3.2%

Average Return: (5.2 - 2.1 + 8.5 + 3.2) / 4 = 3.7%

Deviations squared:
(5.2 - 3.7)² = 2.25
(-2.1 - 3.7)² = 33.64
(8.5 - 3.7)² = 23.04
(3.2 - 3.7)² = 0.25

Sum: 59.18

Variance = 59.18 / 3 = 19.73
Standard Deviation = √19.73 = 4.44%

Interpretation: Portfolio quarterly return typically varies by ±4.44% from average
10.4 Correlation Matrix
Measures relationship between different holdings.
Formula:
Correlation = Covariance(A, B) / (σ_A × σ_B)

Where:
- Covariance = Measure of joint movement
- σ_A, σ_B = Standard deviations of A and B

Correlation ranges from -1 to +1:
- +1 = Perfect positive correlation (move together)
- 0 = No correlation (independent)
- -1 = Perfect negative correlation (move opposite)
Example Portfolio Correlation:
                SBIN    INFY    GOLD    BOND
──────────────────────────────────────────────
SBIN            1.00    0.65   -0.15    0.20
INFY            0.65    1.00   -0.10    0.25
GOLD           -0.15   -0.10    1.00   -0.35
BOND            0.20    0.25   -0.35    1.00

Interpretation:
- SBIN & INFY: 0.65 correlation (move together, moderate)
- GOLD & BOND: -0.35 correlation (move opposite, good diversification)
- SBIN & GOLD: -0.15 correlation (slight negative, diversifying)
10.5 Beta Calculation
Measures portfolio sensitivity to market movements.
Formula:
β = Covariance(Portfolio Return, Market Return) / Variance(Market Return)

Interpretation:
- β = 1.0: Portfolio moves with market
- β > 1.0: Portfolio more volatile than market
- β < 1.0: Portfolio less volatile than market
- β = 0: Portfolio independent of market
Example:
Portfolio returns: [5%, 8%, -3%, 12%, 6%]
Market returns:    [4%, 10%, -2%, 15%, 5%]

Covariance: 23.75
Market Variance: 40.25
Beta = 23.75 / 40.25 = 0.59

Interpretation:
If market rises 10%, portfolio expected to rise 5.9%
Portfolio is defensive (β < 1)
10.6 Treynor Ratio (Risk-Adjusted Return)
Formula:
Treynor Ratio = (Portfolio Return - Risk-free Rate) / Beta

Example:
Portfolio Return: 15%
Risk-free Rate: 6%
Beta: 0.95

Treynor Ratio = (15% - 6%) / 0.95
              = 9% / 0.95
              = 9.47%

Interpretation: Excess return per unit of systematic risk
10.7 Information Ratio
Measures active management performance.
Formula:
Information Ratio = (Portfolio Return - Benchmark Return) / Tracking Error

Where:
Tracking Error = √(Σ(Portfolio Return - Benchmark Return)²)

Example:
Portfolio 1-year return: 15%
Benchmark return: 12%
Tracking Error: 3.5%

Information Ratio = (15% - 12%) / 3.5%
                  = 3% / 3.5%
                  = 0.86

Interpretation: Manager adding 0.86% return per 1% of tracking error
Implementation Checklist
11.1 Backend Development
- Set up database schema for portfolio storage
- Create API endpoints for data ingestion
- Implement CSV parsing and validation
- Set up Gemini API client with error handling
- Create calculation engine for metrics
- Implement caching for performance
- Set up logging and monitoring
- Create database backup procedures
11.2 Frontend Development
- Design responsive UI for dashboard
- Create multi-step wizard for data entry
- Build visualization components (charts, tables)
- Implement file upload functionality
- Create API connection interface
- Add real-time validation feedback
- Build insights display components
- Implement PDF report generation
11.3 Integration
- Integrate Gemini API for insights
- Set up Kuvera API integration
- Set up Zerodha Kite Connect integration
- Set up CAMS integration
- Create fund master database
- Implement benchmark data feeds
- Set up NAV update mechanism
11.4 Security & Compliance
- Implement OAuth 2.0 for API auth
- Add data encryption at rest
- Implement TLS/SSL for all connections
- Set up GDPR compliance
- Create data retention policies
- Add PII masking in logs
- Implement access controls
- Set up audit logging
11.5 Testing
- Create unit tests for calculations
- Create integration tests for APIs
- Test CSV parsing with various formats
- Load test the system
- Security penetration testing
- Test Gemini API integration
- Create test data sets
- Test edge cases
11.6 Documentation
- Create user guide
- Create API documentation
- Document calculation formulas
- Create troubleshooting guide
- Document Gemini integration
- Create FAQ document
- Document data schema
- Create deployment guide
11.7 Deployment
- Set up production environment
- Configure CI/CD pipeline
- Set up monitoring and alerts
- Create backup strategies
- Set up analytics tracking
- Create incident response plan
- Deploy to production
- Monitor initial performance
Frequently Asked Questions
Q1: How accurate is the AI analysis?
A: The Gemini AI analysis is useful for understanding portfolio structure and identifying general trends. It is an educational summary only and is not personalized investment advice. The AI:
- Helps surface possible asset-allocation imbalances
- Calculates performance metrics from the data you provide
- Offers generic, category-level educational observations
- May not account for complex personal circumstances
Outputs are illustrative and educational only. For any actual portfolio decision, consult a qualified professional (e.g. a SEBI-registered Investment Adviser for advice, or a CA for tax planning).
Q2: Why are my holdings showing different values than my broker shows?
A: This can happen due to:
- Timing differences (NAV updates occur once daily)
- Missing recent transactions
- Dividend reinvestment not being synced
- Corporate actions (stock splits, mergers)
Solution: Ensure you've uploaded the latest file and check for any pending transactions.
Q3: Is this tool suitable for NRIs with overseas income?
A: Yes! The analyzer is specifically designed for NRIs. It considers:
- TDS implications on interest/dividends
- NRO vs NRE account classifications
- Repatriation restrictions
- Currency exposure
- International treaty benefits
However, consult a CA for complex tax planning.
Q4: How often should I rebalance?
A: Recommended rebalancing frequency:
- Quarterly: Check if allocation drifted >5%
- Semi-annual: Execute if drift >5-8%
- Annual: Comprehensive review and rebalancing
- Triggered: Major market moves (>15%) or life events
Tax implications increase rebalancing frequency, so plan accordingly.
Q5: What's a good diversification score?
A:
- 80-100: Excellent (low concentration risk)
- 60-79: Good (balanced portfolio)
- 40-59: Fair (some concentration)
- <40: Poor (too concentrated)
Most investors should aim for 60-80 range.
Q6: Can I sync multiple broker accounts?
A: Yes! The analyzer can combine data from:
- Multiple mutual fund platforms (CAMS, MFCENTRAL)
- Multiple brokers (Zerodha, Groww, Angel Broking)
- Direct equity holdings
- Overseas holdings
Upload data manually or use API integrations to consolidate.
Q7: How is XIRR different from average return?
A:
- XIRR: Accounts for timing and amount of each investment
- Average Return: Simple average of periodic returns
XIRR is more accurate when cash flows occur at different times.
Example:
Investment 1: ₹10L on Jan 1, 2022, now worth ₹11L
Investment 2: ₹10L on Dec 31, 2022, now worth ₹10.5L

Average: (10% + 5%) / 2 = 7.5%
XIRR: ~9.2% (accounts for different holding periods)
Q8: What's the difference between equity and debt funds?
A:
| Aspect | Equity | Debt |
|---|---|---|
| Risk | High | Low |
| Returns | 10-15% annually | 5-8% annually |
| Tax | 20% LTCG after 12m | Taxed as income |
| Volatility | High | Low |
| Suitable for | 5+ years | 1-5 years |
Q9: How do I optimize taxes with ELSS?
A: ELSS funds provide:
- ₹1.5L annual deduction under Section 80C
- 3-year lock-in (shortest among 80C instruments)
- Equity tax benefits (20% LTCG tax after 3 years)
- Growth potential at 12-14% annually
Strategy: Invest ₹1.5L annually in ELSS to save ₹37,500-₹47,250 in taxes.
Q10: What's the ideal emergency fund size?
A: For NRIs: 6-12 months of expenses in liquid investments
Composition:
- Savings account: 3 months
- Liquid funds: 3-6 months
- Debt funds: 3-6 months
Keep in both NRO and savings account for accessibility.
Q11: How is portfolio risk calculated?
A: Risk score based on:
- Equity allocation × 18% volatility
- Debt allocation × 5% volatility
- Gold allocation × 12% volatility
- Cash allocation × 0.5% volatility
Example:
45% equity + 35% debt + 15% gold + 5% cash
Risk = (0.45×18%) + (0.35×5%) + (0.15×12%) + (0.05×0.5%)
     = 8.1% + 1.75% + 1.8% + 0.025%
     = 11.675% ≈ Moderate Risk
Q12: Can I compare my portfolio with a benchmark?
A: Yes! The tool compares against:
- Nifty 50: Large-cap benchmark
- Nifty 500: Broad market benchmark
- Balanced Index: Conservative benchmark
- Custom: Create your own benchmark
It calculates:
- Absolute returns vs benchmark
- Alpha (excess return)
- Beta (volatility vs benchmark)
- Sharpe ratio (risk-adjusted return)
Q13: What are the main causes of portfolio overlap?
A:
- Multiple Bluechip funds: Same large-cap holdings
- Multiple Index funds: Intentional redundancy
- Fund-of-funds: Multiple layers of funds
- Lack of strategy: Random selection without planning
- Manager changes: Different funds same exposure
Solution: Review holdings, consolidate to fewer, high-quality funds.
Q14: How do I handle overseas income for portfolio purposes?
A: As NRI, you may have:
- Employment income (salary)
- Investment income (dividends, interest)
- Business income
- Rental income from property
The analyzer:
- Assumes income is taxed in home country
- Considers TDS implications
- Factors in repatriation rules
- Suggests NRO/NRE account structure
Consult CA for specific income questions.
Q15: What's the impact of inflation on long-term returns?
A: Real return = Nominal return - Inflation rate
Example:
Nominal return: 10%
Inflation: 6%
Real return: 4%

For ₹1L invested for 10 years:
- Nominal final value: ₹2.59L
- Real final value (in today's money): ₹1.48L
Solution: Invest in equity (12%+ returns) to beat 5-6% inflation.
Important Disclaimer
The Portfolio Analyzer is an educational tool. Its outputs — including any AI-generated insights, categories, and numbers — are illustrative and for informational purposes only, and are NOT investment advice or a recommendation to buy, sell, hold, or switch any specific security or scheme.
NRI Wealth Partners operates as an AMFI-registered Mutual Fund Distributor (ARN-360468) and provides Chartered Accountant (CA) services. We are NOT a SEBI-registered Investment Adviser or Research Analyst, and nothing in this tool or guide constitutes personalized investment advice.
Mutual fund investments are subject to market risks; read all scheme-related documents carefully. Past performance is not indicative of future results. Any sample fund categories or figures shown are illustrative only. For decisions specific to your circumstances, please consult a SEBI-registered Investment Adviser for investment advice or a qualified CA for tax planning.
Conclusion
The Portfolio Analyzer Tool, powered by Google's Gemini AI, helps NRI investors understand their portfolio structure through educational, category-level insights. By combining calculations with AI-driven analysis, it can support a more informed discussion with a qualified professional, while considering NRI-specific tax and compliance factors. Its outputs are illustrative and educational only, not investment advice.
Key Takeaways:
- Data Integration: Seamlessly import portfolios from multiple sources
- Comprehensive Analysis: Get detailed insights into allocation, risk, and returns
- AI-Powered Insights: Leverage Gemini AI for educational, category-level observations (not investment advice)
- Tax Awareness: Surface general tax-efficiency concepts to discuss with a professional
- Benchmark Comparison: Compare performance against relevant indices
- Educational Insights: Receive illustrative, informational observations
Next Steps:
- Review your current portfolio allocation
- Identify overlaps and high-expense funds
- Calculate your current XIRR and compare with benchmarks
- Implement recommended changes gradually
- Rebalance quarterly and review annually
For questions or support, contact the NRI Wealth Partners team.
NRI Wealth Partners Empowering NRI Investment Decisions Version 1.0 | December 2024
Document Information
Author: NRI Wealth Partners AI Documentation Team Version: 1.0 Status: Final Last Updated: December 2024 Word Count: Approximately 8,500 words Pages (Estimated): 15-20 pages when printed License: NRI Wealth Partners - Proprietary Classification: Technical Documentation